ComponentOne FlexChart for WPF
Column
FlexChart > Understanding FlexChart > FlexChart Types > Column

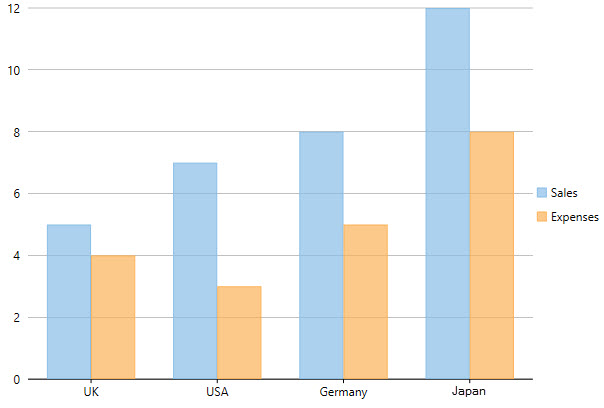
The Column Chart, just like the Bar Chart, represents variation in a data series over time or compares different items. It displays values of one or more items as vertical bars against Y-axis and arranges items or categories on X-axis.

You need to set the ChartType property to Column in the Property window, in the code behind, or in XAML to create the Column Chart.

Set the Stacking property to Stacked or Stacked100pc to create the stacking Column Chart.

Column Chart


The code below demonstrates the implementation:

<c1:C1FlexChart x:Name="flexChart" 
                BindingX="Country" 
                ItemsSource="{Binding DataContext.Data}" 
                ChartType="Column">
    <c1:C1FlexChart.Series>
        <c1:Series SeriesName="Sales" 
                   Binding="Sales"/>
        <c1:Series SeriesName="Expenses" 
                   Binding="Expenses"/>
    </c1:C1FlexChart.Series>
</c1:C1FlexChart>
C#
Copy Code
flexChart.ChartType = C1.Chart.ChartType.Column;