Sunburst, also known as a multi-level pie chart, is ideal for visualizing multi-level hierarchical data depicted by concentric circles.The circle in the center represents the root node, with the data moving outside from the center. A section of the inner circle supports a hierarchical relationship to those sections of the outer circle which lie within the angular area of the parent section.
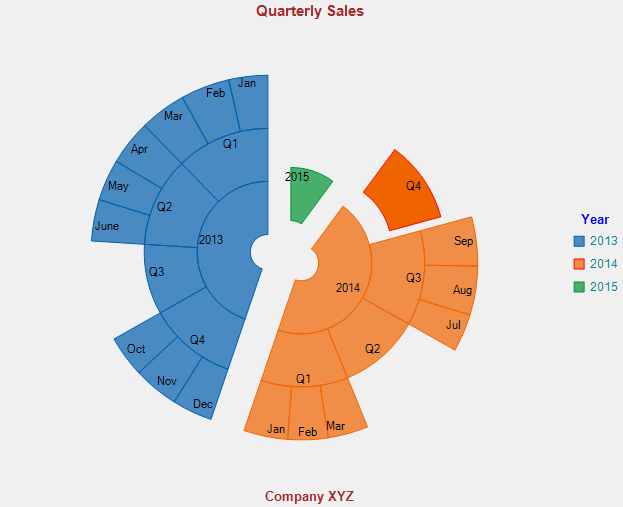
Using Sunburst chart helps the end user to visualize the relationship between outer rings and inner rings. For instance, you might want to display sales report for each quarter of three years. Using SunBurst chart, a sales report of a specific month can be highlighted, thereby depicting relationship with the respective quarter.
To explore the features of Sunburst chart, click the following links: