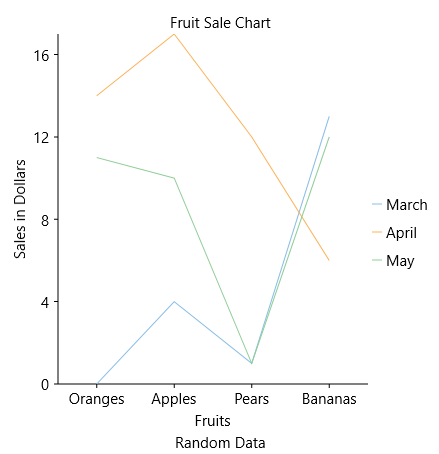
The Line Chart displays trends over a period of time by connecting different data points in a series with a straight line. It treats the input as categorical information that is evenly spaced along the X-axis.
You can create the Line Chart by setting the ChartType property to Line.
To create the stacking Line Chart, you need to set the Stacking property to Stacked or Stacked100pc.