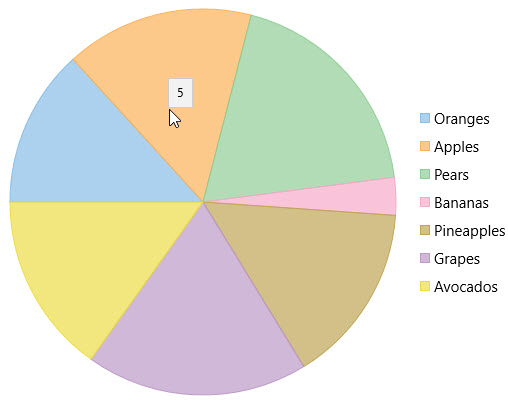
Pie charts are generally used to represent size of items in a series as a percentage of the entire pie. Ideally, the Pie Chart is to be used when you want to plot only one series comprising non-zero and positive values. And the number of categories are not more than seven.
The FlexPie control enables you to create customized pie charts that depict data points as slices of a pie. The arc length of each slice represents the value of that specific slice.

Key Features
-
Header and Footer: Use simple properties to set a title and footer text.
-
Legend: Change position of the legend as needed.
-
Selection: Change the selection mode and customize the selected pie slice appearance.
-
Exploding and Donut Pie Charts: Use simple properties to convert it into an exploding pie chart or a donut pie chart.
-
Data Labels: Add, style, format, set the position of data labels and manage the overlapped data labels on the chart.