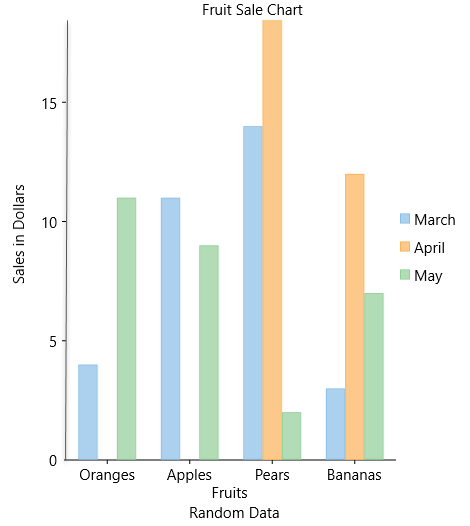
The Column Chart, just like the Bar Chart, represents variation in a data series over time or compares different items. It displays values of one or more items as vertical bars against Y-axis and arranges items or categories on X-axis.
To create the Column Chart, you need to set the ChartType property to Column.