The Bubble Chart, which is basically a type of the scatter chart, is used for graphical representation of multi-dimensional data. It displays an additional data value at each point by changing its size. The chart type represents data points in the form of bubbles (data markers) whose X and Y coordinates are determined by two data values and whose size indicates the value of a third variable.
Therefore, in addition to X and Y you must specify a binding for the bubble size. This is done by setting the binding property to a comma-delimited string that specifies the name of the properties to be used for the Y and size values for each bubble.
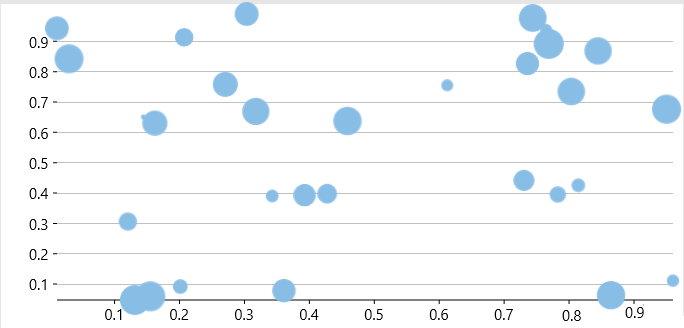
In this example, the chart is bound to a list containing objects with "x", "y", and "size" properties. The chart contains a single series and its binding property is set to the string "y,size".
To create the Bubble Chart, you need to set the ChartType property to Bubble.
| XAML |
Copy Code
|
|---|---|
<Chart:C1FlexChart ItemsSource="{Binding}" ChartType="Bubble" BindingX="X" Binding="Y,Size" Xaml:C1NagScreen.Nag="True" Margin="0,10,-83,0"> </Chart:C1FlexChart> |
|