The C1Chart control supports the following types of Step Charts:
- Step
- StepArea
- StepSymbols
- StepAreaStacked
A Step chart is a form of a XYPlot chart. Step charts are often used when Y values suddenly change by discrete amounts at specific values of X. Plotting a checkbook balance over time is a simple, everyday example.
As each deposit is made and each check is written, the balance (Y value) of the check register changes suddenly, rather than gradually, as time passes (X value). During the time that no deposits are made or no checks are written, the balance (Y value) remains constant as time passes.
Similar to Line and XY plots, the appearance of the step chart can be customized by using the DataSeries.Connection and DataSeries.Symbol properties for each series by changing colors, symbol size, and line thickness.
Symbols can be removed entirely to emphasize the relationship between points or included to indicate actual data values. If data holes are present, the step chart behaves as expected, with series lines demonstrating known information up to the X value of the data hole. Symbols and lines resume once non-hole data is again encountered.
As with most XY style plots, step charts can be stacked when appropriate.
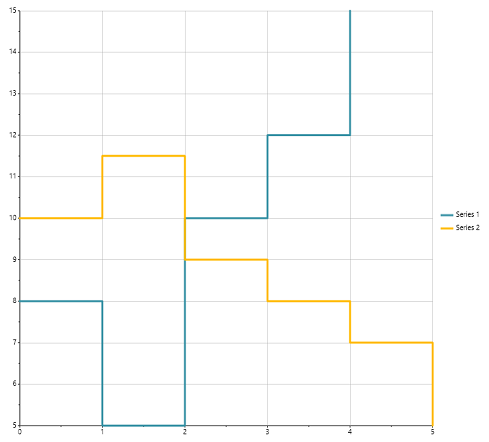
The following image represents the Step chart when you set C1Chart.ChartType property to Step:
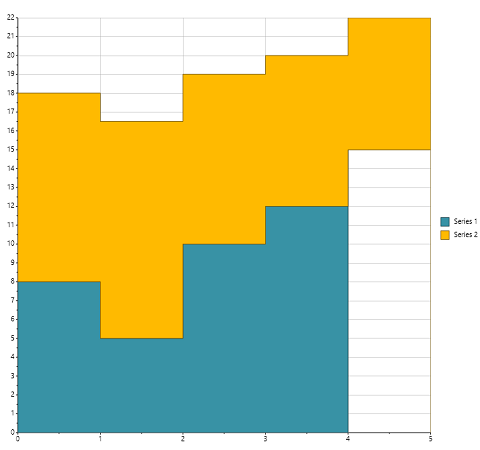
The following image represents the StepArea chart when you set the C1Chart.ChartType property to StepArea:
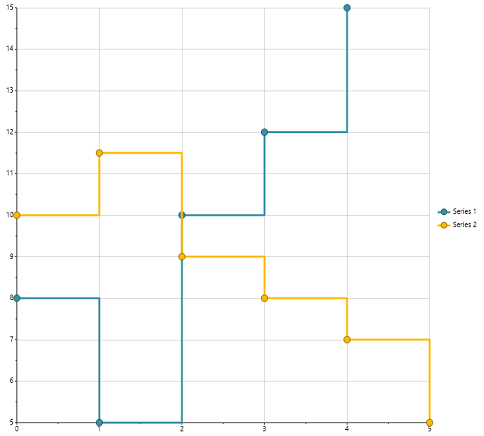
The following image represents the StepSymbols chart when you set the C1Chart.ChartType property to StepSymbols:
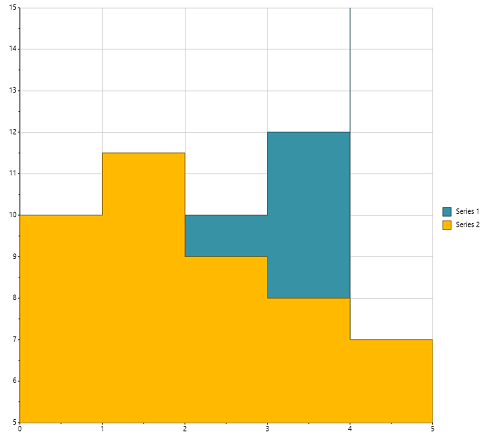
The following image represents the StepAreaStacked chart when you set the C1.ChartType property to StepAreaStacked: