In this last step, you'll adjust the chart's appearance using the C1Chart.Palette property.
To write the code in Visual Basic:
| Visual Basic |
Copy Code
|
|---|---|
c1Chart1.Palette = Palette.Module |
|
To write the code in C#:
| C# |
Copy Code
|
|---|---|
c1Chart1.Palette = Palette.Module; |
|
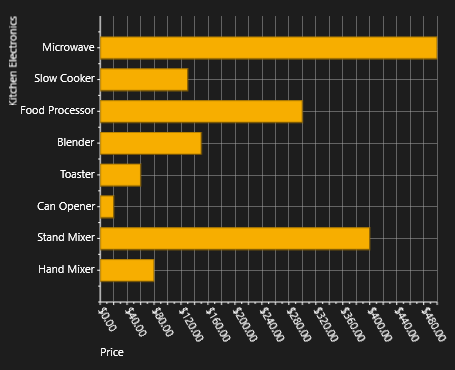
![]() What You've Accomplished
What You've Accomplished
You successfully applied the Module palette to the C1Chart control. When you run your application it appears like the following:
 What You've Accomplished
Congratulations! You've completed the Chart for WinRT quick start. In this Quick Start, you created a chart application, added data to the chart, set the axes bounds, formatted the axes annotation, and customized the appearance of the chart.