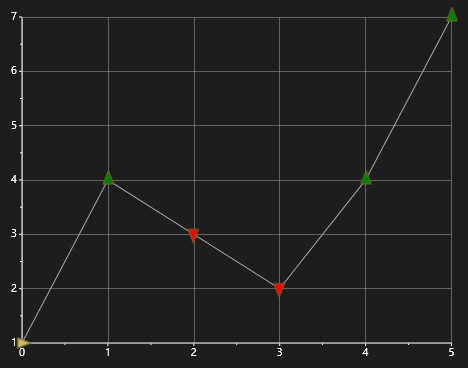
You can set custom symbols for DataSeries to indicate trends in a Line chart:

The following example code shows how to use trend indicators in the chart with triangles used as arrows:
| Visual Basic |
Copy Code
|
|---|---|
c1Chart1.ChartType = ChartType.LineSymbols Dim values As Double() = New Double() {1, 4, 3, 2, 4, 7} Dim ds As New DataSeries() ds.Loaded += Function(sender, args) Do Dim rp As RPolygon = TryCast(sender, RPolygon) If rp IsNot Nothing Then Dim pi As Integer = rp.DataPoint.PointIndex If pi > 0 Then 'rotate triangle and change its color If values(pi) > values(pi - 1) Then rp.RenderTransform = New RotateTransform() rp.RenderTransformOrigin = New Point(0.5, 0.5) rp.Fill = New SolidColorBrush(Colors.Green) ElseIf values(pi) < values(pi - 1) Then rp.RenderTransform = New RotateTransform() rp.RenderTransformOrigin = New Point(0.5, 0.5) rp.Fill = New SolidColorBrush(Colors.Red) End If End If End If End Function c1Chart1.Data.Children.Add(ds) |
|
| C# |
Copy Code
|
|---|---|
c1Chart1.ChartType = ChartType.LineSymbols; double[] values = new double[] { 1, 4, 3, 2, 4, 7 }; DataSeries ds = new DataSeries() { ConnectionStroke = new SolidColorBrush(Colors.DarkGray), ConnectionStrokeThickness=1, Symbol = new RPolygon(), SymbolSize = new Size(18,12), ValuesSource = values }; ds.Loaded += (sender, args) => { RPolygon rp = sender as RPolygon; if (rp != null) { int pi = rp.DataPoint.PointIndex; if (pi > 0) { //rotate triangle and change its color if ( values[pi] > values[pi-1] ) { rp.RenderTransform = new RotateTransform() { Angle = -90 }; rp.RenderTransformOrigin = new Point(0.5, 0.5); rp.Fill = new SolidColorBrush(Colors.Green); } else if (values[pi] < values[pi - 1]) { rp.RenderTransform = new RotateTransform() { Angle = 90 }; rp.RenderTransformOrigin = new Point(0.5, 0.5); rp.Fill = new SolidColorBrush(Colors.Red); } } } }; c1Chart1.Data.Children.Add(ds); |
|