A Polar chart draws the x and y coordinates in each series as (theta,r).
- theta - The amount of rotation from the chart origin. Theta may be specified in either degrees, which is the default, or radians.
- r - The distance from the chart origin
Since the X-axis is a circle, the X-axis maximum and minimum values are fixed.
Polar charts cannot be combined with any other chart type in the same chart area.
The XAML markup below specifies the data values for the XYDataSeries and is used to create the images that follow the markup:
| XAML |
Copy Code
|
|---|---|
<Chart:C1Chart x:Name="chart0" Height="650" Width="750" ChartType="PolarLinesSymbols" Palette="Solstice" Foreground="Black" > <Chart:C1Chart.Data> <Chart:ChartData > <Chart:ChartData.Children> <Chart:XYDataSeries Label="Series 1" Values="5 10 5 10 5 10 5 10 5" XValues="0 45 90 135 180 225 270 315 0" /> <Chart:XYDataSeries Label="Series 2" Values="0 2 4 6 8 10 12 14 16" XValues="0 45 90 135 180 225 270 315 0" /> <Chart:XYDataSeries Label="Series 3" Values="10 15 10 15 10 15 10 15 10" XValues="45 90 135 180 225 270 315 0" /> </Chart:ChartData.Children> </Chart:ChartData> </Chart:C1Chart.Data> </Chart:C1Chart> |
|
Setting the Starting Angle
The PolarRadarOptions.SetStartingAngle attached property of the PolarRadarOptions class sets the starting angle for Polar charts. The default setting for this property is 0. Setting this property to a value other than 0 will move the origin of the chart counter-clockwise by the specified degrees. For instance, setting the PolarRadarOptions.SetStartingAngle attached property to 90, the Polar chart rotates 90 degrees in the counter-clockwise direction.
Types of Polar Charts
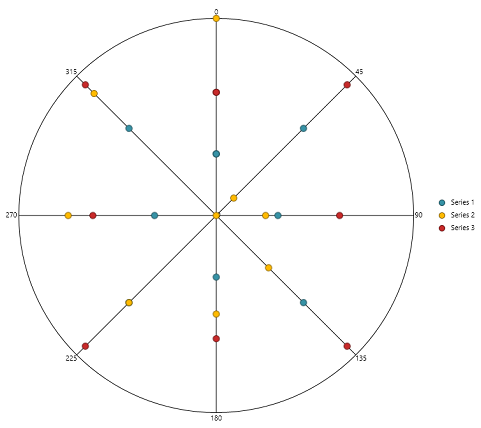
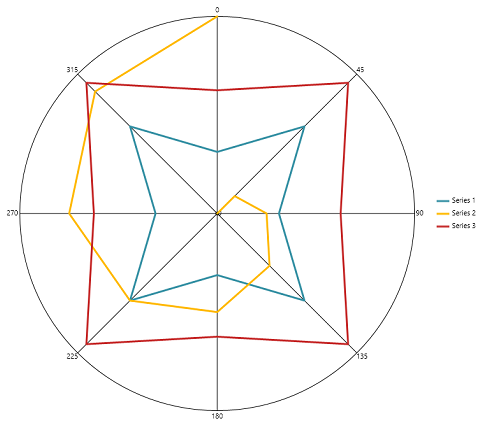
The following image represents the Polar chart when you set C1Chart.ChartType property to PolarLinesSymbols.
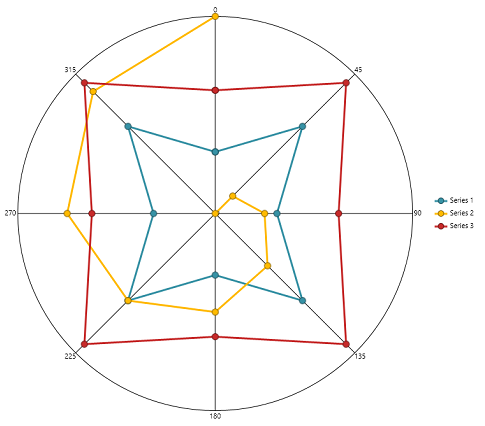
The following image represents the Polar Lines chart with symbols and lines when you set C1Chart.ChartType property to PolarLines.
The following image represents the Polar Symbols chart when you set C1Chart.ChartType property to PolarSymbols.