You can modify the PlotArea’s appearance by using the Background and Stroke/StrokeThickness properties for the border of the plot area. The plot areas are referenced by using the row/column (the same as the elements in the grid), as you can see in the following sample:
| XAML Markup |
Copy Code
|
|---|---|
 <Chart:ChartView.PlotAreas>
      <!-- row=0 col=0 -->
      <Chart:PlotArea Background="#10FF0000" Stroke="Red" />
      <!-- row=1 col=0 -->
      <Chart:PlotArea Row="1" Background="#1000FF00" />
      <!-- row=0 col=1 -->
      <Chart:PlotArea Column="1" Background="#100000FF" />
      <!-- row=1 col=1 -->
      <Chart:PlotArea Row="1" Column="1" Background="#10FFFF00"
Stroke="Yellow" />
    </Chart:ChartView.PlotAreas>
|
|
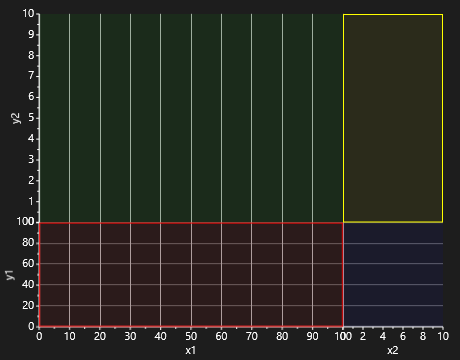
The markup above will result in a chart that resembles the following image:
t