Multiple axes are commonly used when you have the following:
- Two or more Data Series that have mixed types of data which make the scales very different
- A wide range of data values that vary from Data Series to Data Series
The following chart uses two Y Axes to effectively display financial data:
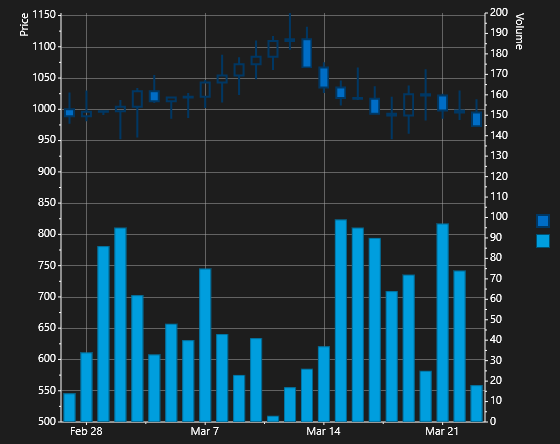
To create a chart that resembles the image above, you'll need a combination of XAML markup and code.
First, you'll create a Candle chart using XAML Markup:
| XAML |
Copy Code
|
|---|---|
<Chart:C1Chart x:Name="chart" Grid.Row="1" Height="450" Width="550" ChartType="Candle" Palette="Flow" Xaml:C1NagScreen.Nag="True"> <Chart:C1Chart.Data> <Chart:ChartData> <Chart:ChartData.Children> <Chart:HighLowOpenCloseSeries SymbolSize="9,9" SymbolStrokeThickness="2" XValueBinding="{Binding Time}" HighValueBinding="{Binding High}" LowValueBinding="{Binding Low}" OpenValueBinding="{Binding Open}" CloseValueBinding="{Binding Close}" PlotElementLoaded="Series_Loaded" /> <Chart:XYDataSeries AxisY="Volume" XValueBinding="{Binding Time}" ValueBinding="{Binding Volume}" /> </Chart:ChartData.Children> </Chart:ChartData> </Chart:C1Chart.Data> <Chart:C1ChartLegend Background="Transparent" BorderBrush="Transparent"/> </Chart:C1Chart> |
|
Then, you'll add the code that will add the two Y axes and the Column chart:
| C# |
Copy Code
|
|---|---|
chart.Data.Children[1].ChartType = ChartType.Column;
                            chart.View.AxisX.Scale = 0.25;
                            chart.View.AxisX.ScrollBar = new AxisScrollBar();
        StackPanel spy = new StackPanel();
                        spy.Orientation = Orientation.Horizontal;
                        spy.HorizontalAlignment = Windows.UI.Xaml.HorizontalAlignment.Left;

                        TextBlock txtPrice = new TextBlock();
                        txtPrice.Text = "Price";
                        txtPrice.TextAlignment = TextAlignment.Right;
                        txtPrice.VerticalAlignment = Windows.UI.Xaml.VerticalAlignment.Bottom;
                        spy.Children.Add(txtPrice);
                        chart.View.AxisY.Min = 500;
                        chart.View.AxisY.Title = spy;
        Axis Volume = new Axis();
                        Volume.Name = "Volume";
                        Volume.Max = 200;
                        Volume.Position = AxisPosition.Far;
                        Volume.AxisType = AxisType.Y;
                        StackPanel spv = new StackPanel();
                        TextBlock txtVol = new TextBlock();
                        txtVol.Text = "Volume";
                        txtVol.Width = 80;
                        spv.Orientation = Orientation.Horizontal;
                        spv.HorizontalAlignment = Windows.UI.Xaml.HorizontalAlignment.Left;
                        spv.Children.Add(txtVol);

                        Volume.Title = spv;
                        chart.View.Axes.Add(Volume);

                        // add panning interation by touch
                        chart.GestureSlide = GestureSlideAction.Translate;
                        chart.ManipulationMode = ManipulationModes.TranslateX | ManipulationModes.TranslateY | ManipulationModes.TranslateInertia;
                        chart.ActionUpdateDelay = 0;
      NewData();
                    }
|
|
For the chart above, you'll also create sample data and bind it to the chart control:
| C# |
Copy Code
|
|---|---|
void NewData() { long ticks = DateTime.Now.Ticks; int len = 100; List<Quotation> data = SampleFinancialData.Create(len); chart.BeginUpdate(); chart.Data.ItemsSource = data; chart.View.AxisX.Min = data[0].Time.ToOADate() - 0.5; chart.View.AxisX.Max = data[len - 1].Time.ToOADate() + 0.5; chart.EndUpdate(); } private void Series_Loaded(object sender, EventArgs e) { } } public class Quotation { public DateTime Time { get; set; } public double Open { get; set; } public double Close { get; set; } public double High { get; set; } public double Low { get; set; } public double Volume { get; set; } } public class SampleFinancialData { static Random rnd = new Random(); public static List<Quotation> Create(int npts) { List<Quotation> data = new List<Quotation>(); DateTime dt = DateTime.Today.AddDays(0); for (int i = 0; i < npts; i++) { Quotation q = new Quotation(); q.Time = dt.AddDays(i); if (i > 0) q.Open = data[i - 1].Close; else q.Open = 1000; q.High = q.Open + rnd.Next(50); q.Low = q.Open - rnd.Next(50); q.Close = rnd.Next((int)q.Low, (int)q.High); q.Volume = rnd.Next(0, 100); data.Add(q); } return data; } } } |
|
It is important to note that adding multiple axes is only limited by your chart area and overall chart readability.
See Also