Chart for WinRT supports the following types of Line charts:
- Line
- LineSmoothed
- LineStacked100pc
- LineSymbols
- LineSymbolsSmoothed
- LineSymbolsStacked
- LineSymbolsStacked100pc
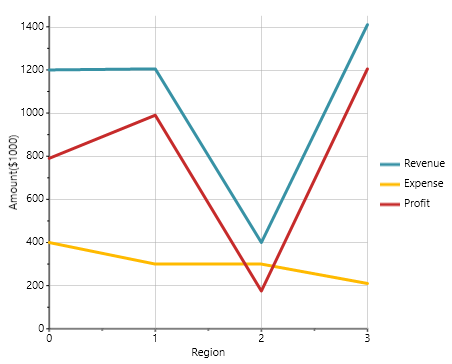
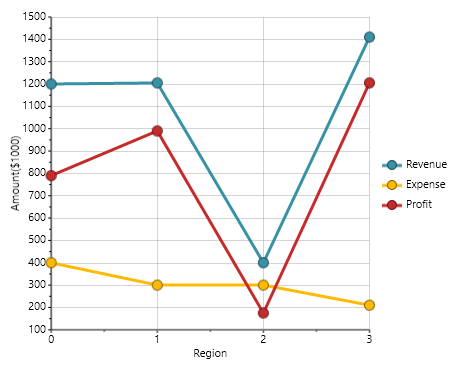
Line
The following image represents a Line chart when you set the C1Chart.ChartType property to Line:
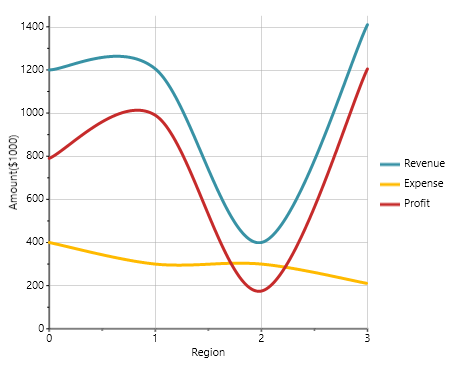
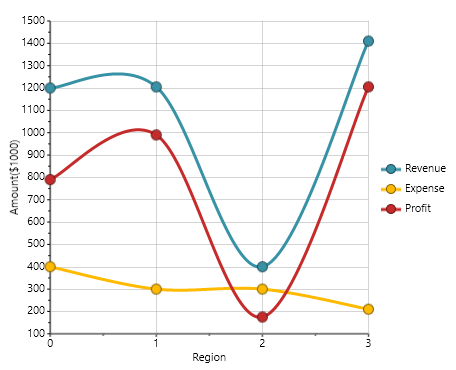
LineSmoothed
The following image represents a LineSmoothed chart when you set the C1Chart.ChartType property to LineSmoothed:
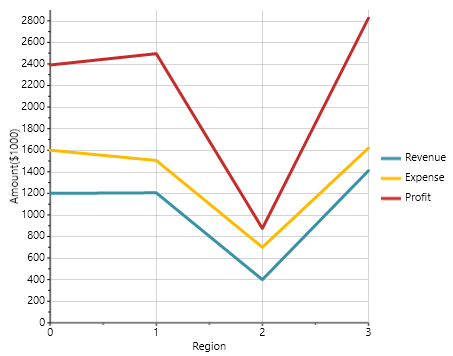
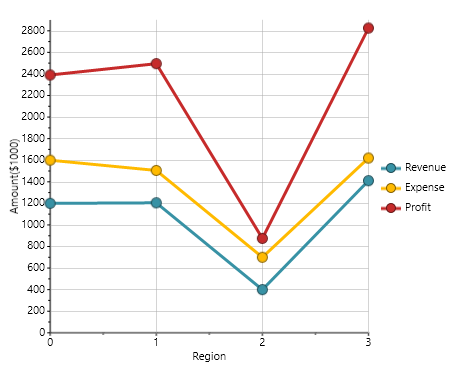
LineStacked
The following image represents a LineStacked chart when you set the C1Chart.ChartType property to LineStacked
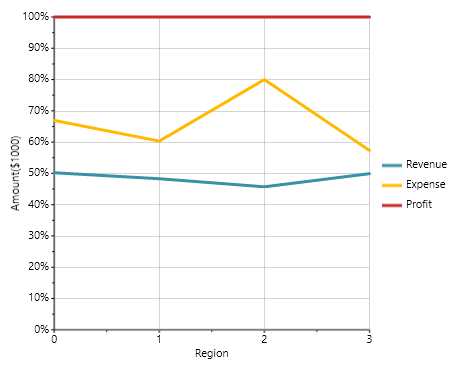
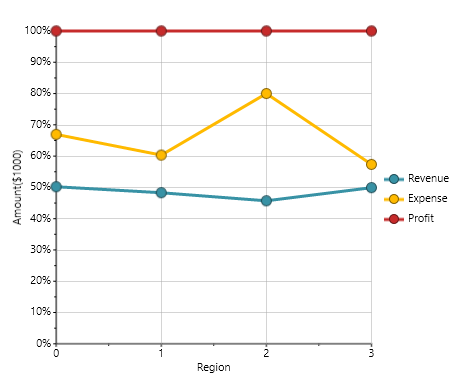
LineStacked100pc
The following image represents a LineStacked100pc chart when you set the C1Chart.ChartType property to LineStacked100pc
LineSymbols
The following image represents a LineSymbols chart when you set the C1Chart.ChartType property to LineSymbols:
LineSymbolsSmoothed
The following image represents a LineSymbolsSmoothed chart when you set the C1Chart.ChartType property to LineSymbolsSmoothed:
LineSymbolsStacked
The following image represents a LineSymbolsStacked chart when you set the C1Chart.ChartType property to LineSymbolsStacked:
LineSymbolsStacked100pc
The following image represents a LineSymbolsStacked100pc chart when you set the C1Chart.ChartType property to LineSymbolsStacked100pc:
The following XAML markup will create a Line chart:
| XAML Markup |
Copy Code
|
|---|---|
<Chart:C1Chart x:Name="chart0" Height="350" Width="450" ChartType="Line" Palette="Solstice" Foreground="Black" > <!-- Populate the chart with three series --> <Chart:C1Chart.Data> <Chart:ChartData > <Chart:ChartData.Children> <Chart:DataSeries Label="Revenue" Values="1200, 1205, 400, 1410" ></Chart:DataSeries> <Chart:DataSeries Label="Expense" Values="400, 300, 300, 210" ></Chart:DataSeries> <Chart:DataSeries Label="Profit" Values="790, 990, 175, 1205" ></Chart:DataSeries> </Chart:ChartData.Children> </Chart:ChartData> </Chart:C1Chart.Data> <!-- Configure axes --> <Chart:C1Chart.View> <Chart:ChartView> <Chart:ChartView.AxisX> <Chart:Axis Title="Region" Height="35"/> </Chart:ChartView.AxisX> <Chart:ChartView.AxisY> <Chart:Axis Title="Amount($1000)" /> </Chart:ChartView.AxisY> </Chart:ChartView> </Chart:C1Chart.View> <Chart:C1ChartLegend Visibility="Visible" Position="Right" /> </Chart:C1Chart> |
|