A Hi-Lo-Open-Close chart marks the highest value of a stock, the lowest value of a stock, the opening value of a stock, and the closing value of a stock. This gives an at-a-glance overview of a stock's performance.
To create a Hi-Lo-Open-Close chart, you need to set C1Chart.ChartType property to Hi-Lo-Open-Close and specify the data values for the XYDataSeries.XValues, HighLowSeries.HighValues, HighLowSeries.LowValues, HighLowOpenCloseSeries.OpenValues, and HighLowOpenCloseSeries.CloseValues, as in the following XAML markup:
| XAML |
Copy Code
|
|---|---|
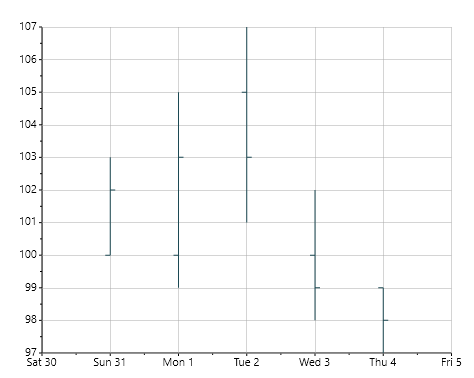
<Chart:C1Chart x:Name="chart0" Height="350" Width="450" ChartType="HighLowOpenClose" Palette="Solstice" Foreground="Black"> <Chart:C1Chart.Data> <Chart:ChartData> <Chart:ChartData.Children> <Chart:HighLowOpenCloseSeries XValues="1 2 3 4 5" HighValues="103 105 107 102 99" LowValues="100 99 101 98 97" OpenValues="100 100 105 100 99" CloseValues="102 103 103 99 98" /> </Chart:ChartData.Children> </Chart:ChartData> </Chart:C1Chart.Data> </Chart:C1Chart> |
|
The markup above will result in a chart like the following image:
See Also