Gantt charts use data series objects of type HighLowSeries. Each data series represents a single task, and each task has a set of start and end values, as well as an XValue. Simple tasks have one start value and one end value. Tasks that are composed of multiple sequential sub-tasks have multiple pairs of start and end values.
The following image represents a Gantt chart:
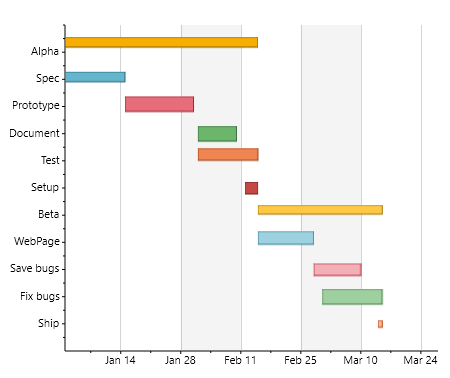
In the code that follows, you'll set the chart type and create the Gantt chart tasks; the code creates one HighLowSeries for each task. In addition to setting the series Label, LowValuesSource and HighValuesSource properties for each DataSeries, the code uses the DataSeries.SymbolSize property to set the height of each bar.
Finally, the code customizes the axes. The Y axis is reversed so the first task appears at the top of the chart. The axes are configured to show vertical grid lines and alternating bands.
 |
All the code that follows should be placed within the InitializeComponent() method. You will also need to add a C1Chart control to your MainPage.xaml page and name it "c1Chart1". |
To demonstrate Gantt charts, let's start by defining the ChartType and ItemNames:
| C# |
Copy Code
|
|---|---|
//set the Chart Type c1Chart1.ChartType = ChartType.Gantt; //create Gantt chart c1Chart1.Data.ItemNames = new string[] { "Alpha", "Spec", "Prototype", "Document", "Test", "Setup", "Beta", "WebPage", "Save bugs", "Fix bugs", "Ship" }; |
|
Next, you'll set the HighLowSeries for each task:
| C# |
Copy Code
|
|---|---|
var ds1 = new HighLowSeries() { Label = "Alpha" }; ds1.XValuesSource = new double[] { 0 }; ds1.LowValuesSource = new DateTime[] {new DateTime(2012, 1, 1)}; ds1.HighValuesSource = new DateTime[] {new DateTime(2012, 2, 15)}; ds1.SymbolSize = new Size(10, 30); c1Chart1.Data.Children.Add(ds1); var ds2 = new HighLowSeries() {Label = "Spec"}; ds2.XValuesSource = new double[] { 1 }; ds2.LowValuesSource = new DateTime[] { new DateTime(2012, 1, 1) }; ds2.HighValuesSource = new DateTime[] { new DateTime(2012, 1, 15) }; ds2.SymbolSize = new Size(10, 15); c1Chart1.Data.Children.Add(ds2); var ds3 = new HighLowSeries() {Label = "Prototype"}; ds3.XValuesSource = new double[] { 2 }; ds3.LowValuesSource = new DateTime[] { new DateTime(2012, 1, 15) }; ds3.HighValuesSource = new DateTime[] { new DateTime(2012, 1, 31) }; ds3.SymbolSize = new Size(15, 20); c1Chart1.Data.Children.Add(ds3); var ds4 = new HighLowSeries() {Label = "Document"}; ds4.XValuesSource = new double[] { 3 }; ds4.LowValuesSource = new DateTime[] { new DateTime(2012, 2, 1) }; ds4.HighValuesSource = new DateTime[] { new DateTime(2012, 2, 10) }; ds4.SymbolSize = new Size(15, 15); c1Chart1.Data.Children.Add(ds4); var ds5 = new HighLowSeries() { Label = "Test" }; ds5.XValuesSource = new double[] { 4 }; ds5.LowValuesSource = new DateTime[] { new DateTime(2012, 2, 1) }; ds5.HighValuesSource = new DateTime[] { new DateTime(2012, 2, 15) }; ds5.SymbolSize = new Size(12, 25); c1Chart1.Data.Children.Add(ds5); var ds6 = new HighLowSeries() { Label = "Setup" }; ds6.XValuesSource = new double[] { 5 }; ds6.LowValuesSource = new DateTime[] { new DateTime(2012, 2, 12) }; ds6.HighValuesSource = new DateTime[] {new DateTime(2012, 2, 15) }; ds6.SymbolSize = new Size(12, 12); c1Chart1.Data.Children.Add(ds6); var ds7 = new HighLowSeries() { Label = "Beta" }; ds7.XValuesSource = new double[] { 6 }; ds7.LowValuesSource = new DateTime[] {new DateTime(2012, 2, 15) }; ds7.HighValuesSource = new DateTime[] {new DateTime(2012, 3, 15) }; ds7.SymbolSize = new Size(9, 20); c1Chart1.Data.Children.Add(ds7); var ds8 = new HighLowSeries() { Label = "WebPage" }; ds8.XValuesSource = new double[] { 7 }; ds8.LowValuesSource = new DateTime[] { new DateTime(2012, 2, 15) }; ds8.HighValuesSource = new DateTime[] { new DateTime(2012,2, 28) }; ds8.SymbolSize = new Size(13, 22); c1Chart1.Data.Children.Add(ds8); var ds9 = new HighLowSeries() { Label = "Save bugs" }; ds9.XValuesSource = new double [] { 8 }; ds9.LowValuesSource = new DateTime[] { new DateTime(2012, 2, 28) }; ds9.HighValuesSource = new DateTime[] { new DateTime(2012, 3, 10) }; ds9.SymbolSize = new Size(12, 12); c1Chart1.Data.Children.Add(ds9); var ds10 = new HighLowSeries() { Label = "Fix bugs" }; ds10.XValuesSource = new double[] { 9 }; ds10.LowValuesSource = new DateTime[] { new DateTime(2012, 3, 1) }; ds10.HighValuesSource = new DateTime[] { new DateTime(2012, 3, 15) }; ds10.SymbolSize = new Size(15, 15); c1Chart1.Data.Children.Add(ds10); var ds11 = new HighLowSeries() { Label = "Ship" }; ds11.XValuesSource = new double[] { 10 }; ds11.LowValuesSource = new DateTime[] { new DateTime(2012, 3, 14) }; ds11.HighValuesSource = new DateTime[] { new DateTime(2012, 3, 15) }; ds11.SymbolSize = new Size(7, 7); c1Chart1.Data.Children.Add(ds11); |
|
You can also set the Palette property for the chart to customize the chart's appearance:
| C# |
Copy Code
|
|---|---|
c1Chart1.Palette = Palette.Module; |
|
Finally, you can customize the chart axes and reverse the Y axis:
| C# |
Copy Code
|
|---|---|
//customize Y axis var ax = c1Chart1.View.AxisY; ax.Reversed = true; ax.MajorGridStroke = null; //customize X axis ax = c1Chart1.View.AxisX; ax.MajorGridStrokeDashes = null; ax.MajorGridFill = new SolidColorBrush(Color.FromArgb(20, 120, 120, 120)); ax.Min = new DateTime(2012, 1, 1).ToOADate(); |
|