A Candle chart is a special type of Hi-Lo-Open-Close chart that is used to show the relationship between the open and close values as well as the high value and the low value. Like Hi-Lo-Open-Close charts, Candle charts use the same price data (time, high, low, open, and close values) except they include a thick candle-like body.
The Candle chart is made up of the following elements:
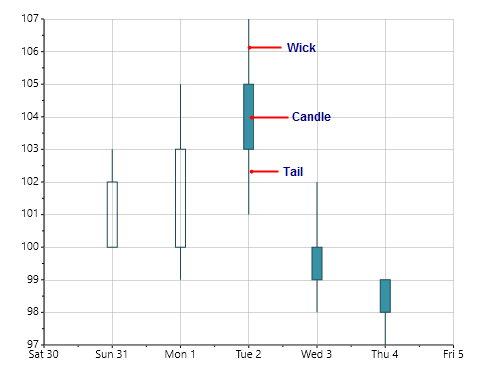
- candle
The thick, candle-like body uses color and size to reveal additional information about the relationship between the open and close values. A long, transparent candle shows buying pressure, and a shorter, filled candle shows selling pressure.
A hollow or transparent candle indicates a rising stock price (close was higher than open). In a hollow candle, the bottom of the body represents the opening price and the top of the body represents the closing price.
A filled candle indicates a falling stock price (open was higher than close). In a filled candle the top of the body represents the opening price and the bottom of the body represents the closing price.
- wick
The wick is the line above the candle, which depicts the high range.
- tail
The tail is the line below the candle, which depicts the low range.
The image below labels the candle chart elements:
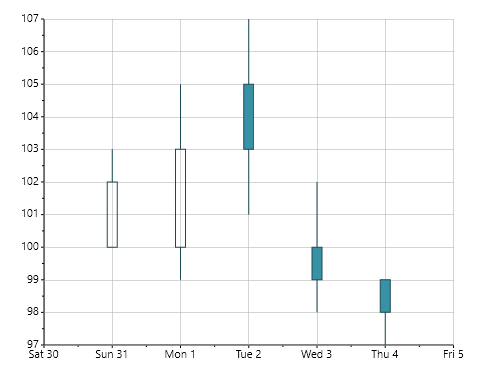
To create a Candle chart, set C1Chart.ChartType property to Candle and specify the data values for the XYDataSeries.XValues, HighLowSeries.HighValues, HighLowSeries.LowValues, HighLowOpenCloseSeries.OpenValues, and HighLowOpenCloseSeries.CloseValues, as in the following XAML markup:
| XAML |
Copy Code
|
|---|---|
<Chart:C1Chart x:Name="chart0" ChartType="Candle" Height="350" Width="450" Palette="Solstice" Foreground="Black"> <Chart:C1Chart.Data> <Chart:ChartData> <Chart:ChartData.Children> <Chart:HighLowOpenCloseSeries XValues="1 2 3 4 5" HighValues="103 105 107 102 99" LowValues="100 99 101 98 97" OpenValues="100 100 105 100 99" CloseValues="102 103 103 99 98" /> </Chart:ChartData.Children> </Chart:ChartData> </Chart:C1Chart.Data> </Chart:C1Chart> |
|
The XAML markup above will result in a chart that resembles the following image: