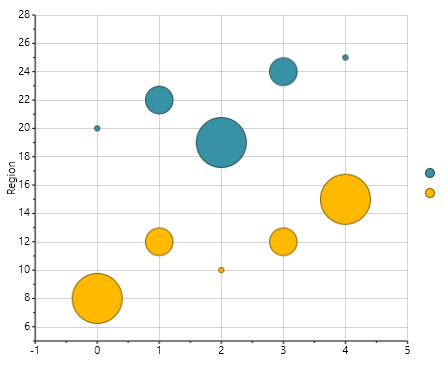
The following image represents the Bubble chart when you set C1Chart.ChartType property to Bubble:
The XAML markup below will create a bubble chart like the above image:
| XAML |
Copy Code
|
|---|---|
<Chart:C1Chart x:Name="chart0" Height="650" Width="750" ChartType="Bubble" Palette="Solstice" Foreground="Black"> <!-- Populate the chart with four series --> <Chart:C1Chart.Data> <Chart:ChartData> <Chart:ChartData.Children> <Chart:BubbleSeries Values="20 22 19 24 25" SizeValues="1 2 3 2 1" /> <Chart:BubbleSeries Values="8 12 10 12 15" SizeValues="3 2 1 2 3" /> </Chart:ChartData.Children> </Chart:ChartData> </Chart:C1Chart.Data> <!-- Configure axes --> <Chart:C1Chart.View> <Chart:ChartView> <Chart:ChartView.AxisX> <Chart:Axis /> </Chart:ChartView.AxisX> <Chart:ChartView.AxisY> <Chart:Axis Title="Region" Height="35"/> </Chart:ChartView.AxisY> </Chart:ChartView> </Chart:C1Chart.View> <Chart:C1ChartLegend Visibility="Visible" Position="Right" /> </Chart:C1Chart> |
|