Bar and Column Charts are very similar, and use similar forms of data to populate the chart. The only difference between them is in the setup of the axes. In a Bar chart, the data runs along the horizontal, or X axis, while in a Column chart, the chart data runs along the vertical, or Y axis.
Chart for WinRT supports the following types of Bar and Column charts:
- Bar or Column
- BarStacked or ColumnStacked
- BarStacked100pc or ColumnStacked100pc
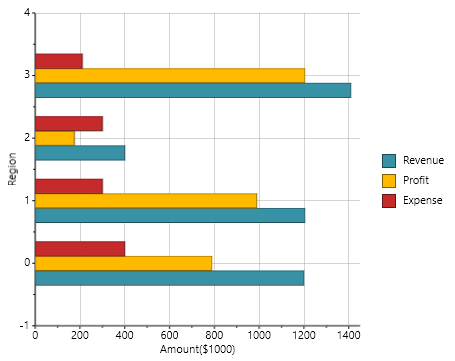
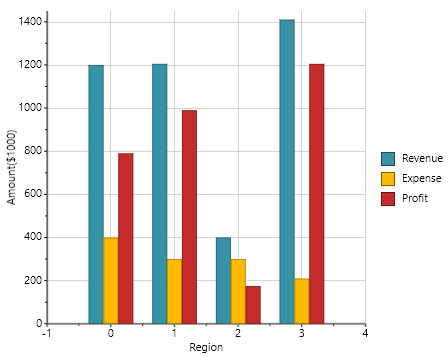
Bar Chart or Column Chart
The following image represents the C1Chart control when you set the C1Chart.ChartType property to Bar or to Column:
 |
 |
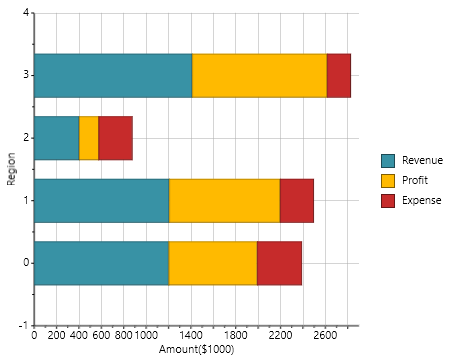
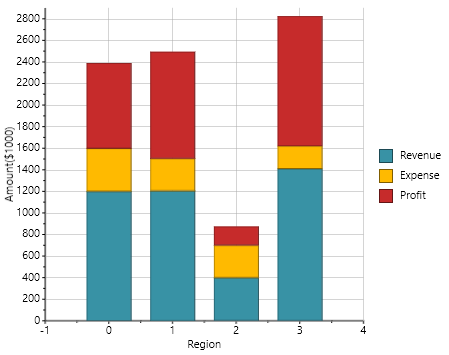
BarStacked or ColumnStacked
The following image represents the C1Chart control when you set the C1Chart.ChartType property to BarStacked or to ColumnStacked:
 |
 |
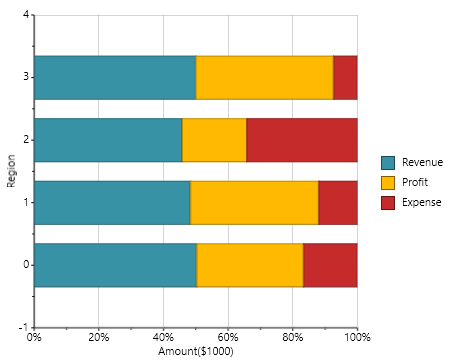
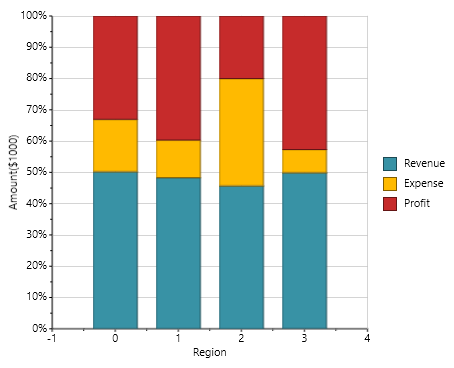
BarStacked100pc or ColumnStacked100pc
The following image represents the C1Chart control when you set the C1Chart.ChartType property to BarStacked100pc or to ColumnStacked100pc:
 |
 |
Use the following XAML markup to create a Bar or Column chart. Note that when creating a Column chart, the X and Y axis values should be reversed:
| XAML Markup |
Copy Code
|
|---|---|
<Chart:C1Chart x:Name="chart0" Height="350" Width="450" ChartType="Bar" Palette="Solstice" Foreground="Black" > <!-- Populate the chart with three series --> <Chart:C1Chart.Data> <Chart:ChartData > <Chart:ChartData.Children> <Chart:DataSeries Label="Revenue" Values="1200, 1205, 400, 1410" ></Chart:DataSeries> <Chart:DataSeries Label="Profit" Values="790, 990, 175, 1205" ></Chart:DataSeries> <Chart:DataSeries Label="Expense" Values="400, 300, 300, 210" ></Chart:DataSeries> </Chart:ChartData.Children> </Chart:ChartData> </Chart:C1Chart.Data> <!-- Configure axes --> <Chart:C1Chart.View> <Chart:ChartView > <Chart:ChartView.AxisX> <Chart:Axis Title="Amount($1000)" Min="0" Max="1450" MajorUnit="200" /> </Chart:ChartView.AxisX> <Chart:ChartView.AxisY> <Chart:Axis Title="Region" Height="35" /> </Chart:ChartView.AxisY> </Chart:ChartView> </Chart:C1Chart.View> <Chart:C1ChartLegend Visibility="Visible" Position="Right" /> </Chart:C1Chart> |
|