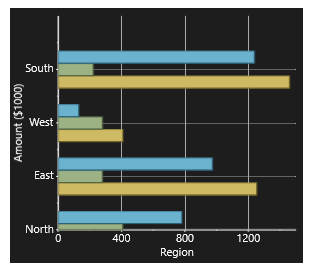
The chart automatically sets up the axis with both major and minor ticks. Customizing the tick spacing or attributes is as easy as manipulating a set of properties.
The Axis.MajorUnit and Axis.MinorUnit properties set the state of the Axis' tick marks. To eliminate clutter in a chart, you can display fewer labels or tick marks on the category (x) axis by specifying the intervals at which you want the categories to be labeled, or by specifying the number of categories that you want to display between tick marks.
Specifying the Major and Minor Ticks
There are two types of ticks on the axis: the major tick has a small line and corresponding label while the minor tick has only the line across the axis.
By default, the distance between ticks is calculated automatically.
To set a specific distance, use the Axis.MajorUnit and Axis.MinorUnit properties.
Default Ticks
The following image displays the default ticks:

Custom Ticks
The following chart image uses the Axis.MajorUnit and Axis.MinorUnit properties to set the specific distance, for example:
| Visual Basic |
Copy Code
|
|---|---|
c1Chart1.View.AxisY.MajorUnit = 5 c1Chart1.View.AxisY.MinorUnit = 1 |
|
| C# |
Copy Code
|
|---|---|
c1Chart1.View.AxisY.MajorUnit = 5; c1Chart1.View.AxisY.MinorUnit = 1; |
|
Time Axis
For time axis you can specify the Axis.MajorUnit and Axis.MinorUnit as a TimeSpan value:
| Visual Basic |
Copy Code
|
|---|---|
c1Chart1.View.AxisY.MajorUnit = TimeSpan.FromHours(12) |
|
| C# |
Copy Code
|
|---|---|
c1Chart1.View.AxisY.MajorUnit = TimeSpan.FromHours(12); |
|