An Area chart draws each series as connected points of data, filled below the points. Each series is drawn on top of the preceding series. The series can be drawn independently or stacked. Chart for WinRT supports the following types of Area charts:
- Area
- AreaSmoothed
- AreaStacked
- AreaStacked100pc
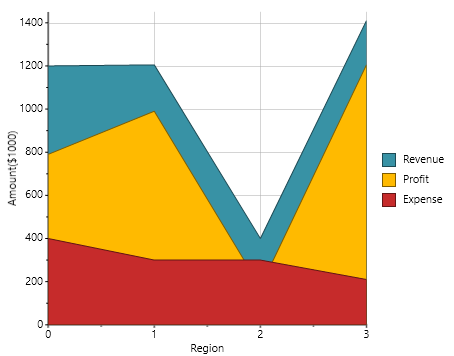
Area Chart
The following image represents the C1Chart control when you set the C1Chart.ChartType property to Area:
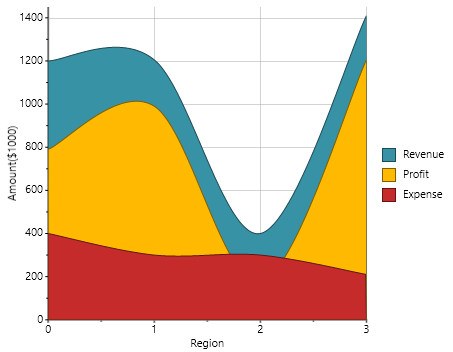
AreaSmoothed
The following image represents the Area Smoothed chart when you set the C1Chart.ChartType property to AreaSmoothed:
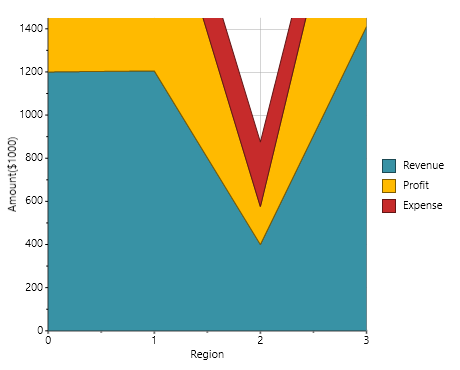
AreaStacked
The following image represents the Area Stacked chart when you set the C1Chart.ChartType property to AreaStacked:
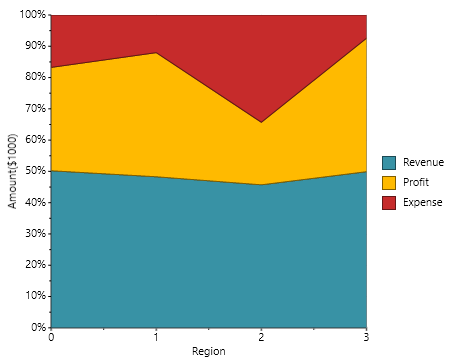
AreaStacked100pc
The following image represents the Area Stacked 100 Percent chart when you set the C1Chart.ChartType property to AreaStacked100pc:
Use the following XAML markup to create an Area chart:
| XAML Markup |
Copy Code
|
|---|---|
<Chart:C1Chart x:Name="chart0" Height="350" Width="450" ChartType="Area" Palette="Solstice" Foreground="Black" > <!-- Populate the chart with three series --> <Chart:C1Chart.Data> <Chart:ChartData > <Chart:ChartData.Children> <Chart:DataSeries Label="Revenue" Values="1200, 1205, 400, 1410" ></Chart:DataSeries> <Chart:DataSeries Label="Profit" Values="790, 990, 175, 1205" ></Chart:DataSeries> <Chart:DataSeries Label="Expense" Values="400, 300, 300, 210" ></Chart:DataSeries> </Chart:ChartData.Children> </Chart:ChartData> </Chart:C1Chart.Data> <!-- Configure axes --> <Chart:C1Chart.View> <Chart:ChartView> <Chart:ChartView.AxisX> <Chart:Axis Title="Region" Height="35"/> </Chart:ChartView.AxisX> <Chart:ChartView.AxisY> <Chart:Axis Title="Amount($1000)" Min="0" Max="1450" MajorUnit="200" /> </Chart:ChartView.AxisY> </Chart:ChartView> </Chart:C1Chart.View> <Chart:C1ChartLegend Visibility="Visible" Position="Right" /> </Chart:C1Chart> |
|