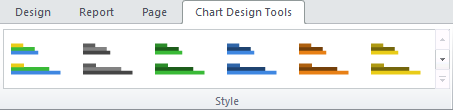
In the Chart Design Tools toolbar, you can change the style of the chart and perform actions such as selecting predefined chart styles, swapping data on the axes, and toggling the legend on and off.
To change chart styles
- Click a chart to reveal the adorners.
- Above the toolbar, select the Chart Design Tools Tab. The Chart Design Tools toolbar appears.
- From the Styles section of the toolbar, select the chart style that you want to use.
To swap chart data axes
- Click a chart to select it.
- Above the toolbar, select the Chart Design Tools Tab. The Chart Design Tools toolbar appears.
- In the Legend section of the toolbar, click Swap Data. The chart data switches the axis on which it is displayed.
To toggle the chart legend
- Click a chart to select it.
- Above the toolbar, select the Chart Design Tools Tab. The Chart Design Tools toolbar appears.
- In the Legend section of the toolbar, click Show Legend. The legend element of the chart is hidden.
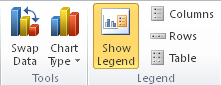
- To display the chart legend, click Show Legend again, or in the Report toolbar at the top right, click the Undo button.
See Also