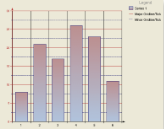
Gridlines and tick marks are generally used to help increase the readability of a chart.
 |
Types
There are two kinds of gridlines and tick marks in the Chart control: major and minor. The properties for the major gridlines and tick marks are set on the MajorTick object of the particular axis and the properties for minor gridlines and ticks are set on the MinorTick object of the axis. The location for any labels shown for the axis are determined by the Step property of the MajorTick object.
Step and TickLength
For either the MajorTick or MinorTick objects, you can define where the tick marks and gridlines will appear by setting the Step property. The TickLength property allows you to set the region the tick mark will extend outside of the axis line.
 |
Tip: To set a specific tick interval using the Step property, you should set the SmartLabels property to False. |
Visible
To make any defined major or minor tick marks to show up at design time or run time, the Visible property of the MajorTick or MinorTick object must be set to True. To show major or minor gridlines at design time or run time, the Visible property of the WallXY object as well as that of the MajorTick or MinorTick object must be set to True.
 Show All
 Hide All