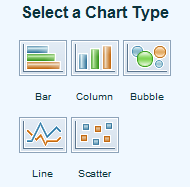
The Chart report item supports several chart types. When you first drag an entity onto the report, you can select the general type that shows your particular data in the most informative way: Bar, Column, Bubble, Line, or Scatter.
Once you have selected a basic chart type, you can access more chart types on the Chart Design Tools tab.
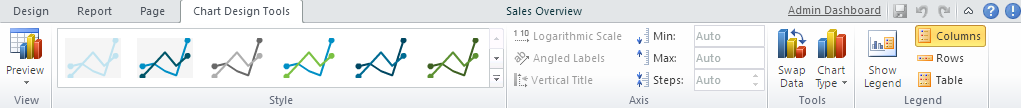
You can click the Chart Type button on the toolbar to reveal all of the more detailed chart types.
 |
Column Charts
Column charts present each series as a vertical column, and group the columns by category. The y-axis values determine the heights of the columns, while the x-axis displays the category labels.
- Simple
- Stacked
- 100% Stacked
Bar Charts
Bar charts present each series as a horizontal bar, and group the bars by category. The x-axis values determine the lengths of the bars, while the y-axis displays the category labels.
- Simple
- Stacked
- 100% Stacked
Bubble Charts
Bubble charts present each series as a bubble. The Bubble chart is an XY chart in which bubbles represent data points. The first Y value is used to plot the bubble along the Y axis, and the second Y value is used to set the size of the bubble.
Line and Scatter Charts
Line charts present each series as a point, and connect the points with a line. The y-axis values determine the heights of the points, while the x-axis displays the category labels.
- Simple
Scatter charts present each series as a point. The y-axis values determine the heights of the points, while the x-axis displays the category labels.
- Simple
- Scatter-Lines