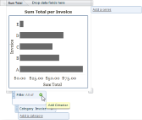
You can add filters to limit the amount of data displayed in your chart using the Filter adorner. You can also group them or make them interactive with parameters.
To add a chart filter
- Click the chart to reveal the chart adorners.
- Click the Add criterion icon to add a filter.

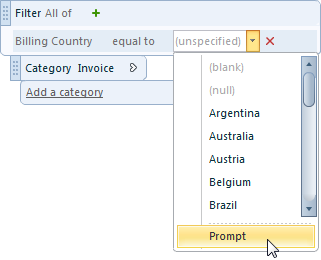
- Drop down the default attributes and select one to add it to the list of filters.
- The default comparison operator is equal to. To select a different comparison operator, click the drop-down arrow to the right. A different set of comparison operators are available depending on the data type of the attribute.
Available Comparison Operators
Operator Name Description equal to Displays only data that is the same as the specified value. not equal to Displays only data that is not the same as the specified value. begins with Displays only data that begins with the specified letter. after Displays only data that has a value higher than the specified value. before Displays only data that has a value lower than the specified value. between Displays only data that has a value that falls between the two specified values. in this list Displays only data that has a value in the specified list of values. - To enter a value with which to compare data, type one in the (unspecified) text box, or drop down the list of values to the right and double-click to select one.

Tip: Select (null) to find null values. For example, if you are looking for living people, you would want a "date of death" attribute to be (null). You can use (blank) to find values such as descriptions that were left blank. - To allow the user to select values for the filter, select Prompt.

See Making Interactive Chart Filtersand Working with Parameters for more information on this option.
See Also