ActiveReports allows you to use parameters to filter or add the data to display in reports at run time. You can either prompt users for parameters so that they control the output, or supply the parameters behind the scenes.
This tutorial guides you through the steps to create a parameterized report in ActiveReports Web Designer.
- Access the ActiveReports Web Designer
- Create Report Layout
- Bind Data to Table Data Region
- Add Parameter to the Report
- Manage Data in the Report
- Customize the Appearance of Parameterized Report
- Preview and Save Subreport
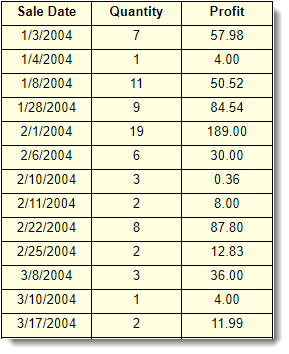
After you complete this tutorial, you will have a report that looks similar to the following.
(Parameter1 = Canada West and Parameter2 = 1005)
Access the ActiveReports Web Designer
Run the Web Designer sample (WebDesigner_MVC(Core)) located here: C:\Users\GPCTAdmin\Documents\GrapeCity Samples\ActiveReports 13\Web.
The Web Designer is opened in browser ready to create your reports.
Create Report Layout
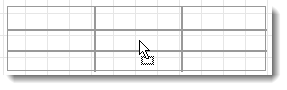
Let us use Table data region to the display data. Drag and drop Table data region  onto the design area of the report.
Bind Data to Table Data Region
- To view fields in the added data set, click the dropdown next to the SalesByRegion data set.
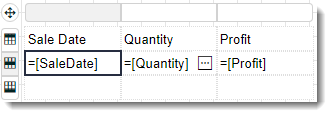
- To fill the table with data, drag and drop the fields onto the columns of the detail row.
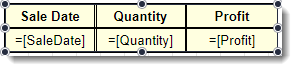
In our case, drag and drop the SaleDate field on the first column, Quantity field on the second column, and Profit field on the third column. The Header row above the details row is automatically filled with labels.
- To remove the table footer, right-click the bottom row and select Remove Footer.
Add Parameter to the Report
Let us add two parameters that would act as filters for data retrieved from the data source, one would be passed as filter for the region, and the other to filter the data according to store.
-
To add a report parameter that filters the data according to the region,
- From the top right corner of Web Designer, click the Data icon
 .
. - Click Add next to Parameters. A parameter named Parameter1 is added.
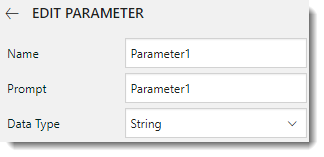
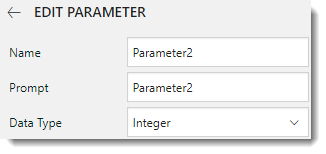
- Click Parameter1 to edit parameter properties.
- Set Data Type property to String.
The following image shows how these properties are set:
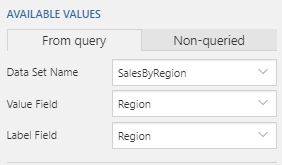
- Go to From query tab and set the following properties.
Property Value Data Set Name SalesByRegion Value Field Region Label Field Region The following image shows how these properties are set:
To add parameter that filters the data according to the store, - From the top right corner of Web Designer, click the Data icon .
- Click Add next to Parameters. A parameter named Parameter2 is added.
- Click Parameter2 to edit parameter properties.
- Set Data Type property to Integer.
The following image shows how these properties are set:
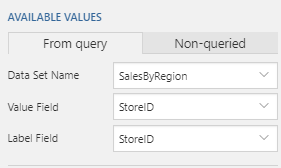
- Go to From query tab and set the following properties.
Property Value Data Set Name SalesByRegion Value Field Store Label Field Store
The following image shows how these properties are set:
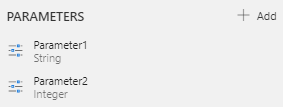
The Parameters property now shows the two parameters as follows.
Manage Data in the Report
In order to control the amount of data rendered in the report, we can add filters to the Table data region. In our report, we will be adding two filters as follows.
-
To add filter that renders data according to the user input in the parameter (Parameter1),
- Select the table and go to Properties pane.
- In the Filters property, click Show Items, and then select Add Item.
- Click
 to display the filter properties.
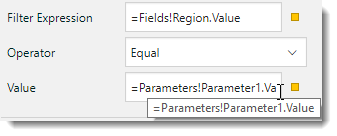
 - Click the radio button next to Filter Expression to display the fields and select Region.
- Click the drop down next to Operator and select 'Equal'.
- Click the radio button next to Value and enter the expression
=Parameters!Parameter1.Value.To add filter that limits the data according to store parameter (Parameter2),
- In the Filters property, click Show Items, and then select Add Item.
- Click to display the filter properties.
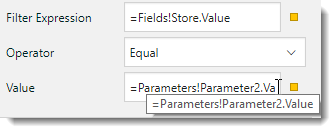
- Click the radio button next to Filter Expression to display the fields and select Store.
- Click the drop down next to Operator and select 'Equal'.
- Click the radio button next to Value and enter the expression
=Parameters!Parameter2.Value.
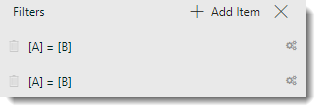
The Filters property now shows the two filters as follows.
Customize the Appearance of Parameterized Report
Note: You may need to resize and reposition the controls on the report to accommodate data, and for a cleaner look.
- To apply background color to the table, select the Table data region.
- Set the BACKGROUND - Color property to Light Yellow from the colors available on Web tab of the color pallet.
- To customize the Header row of the table, set the following properties for each text box in the row.
Property Value TEXT - Font Weight Bold
TEXT - Text Align Center
- To customize the Details row of the table, set the TEXT - Text Align property for each text box to Center.
- To apply borders, select each cell of the table and set its BORDER - Style property to Solid.
Preview and Save Report
- Click Preview
 to view your report in the final output. You will be prompted to select the region name and the store id.
Note: The values in the Parameter list are not sorted. To sort the values in the Parameter list, you need to have sorted data set.
to view your report in the final output. You will be prompted to select the region name and the store id.
Note: The values in the Parameter list are not sorted. To sort the values in the Parameter list, you need to have sorted data set. - Exit the preview mode by clicking Back on the left side of the designer.
- Click Save to open the Save dialog box. Enter the report name as 'Detail Report' and click Save Report.