Visual Query Designer is a graphical interface that simplifies data binding by allowing users to interactively build queries and view the results. With the Visual Query Designer's interactive interface, users who are unfamiliar with SQL can easily design, edit and preview queries.
Visual Query Designer supports the following SQL capabilities:
- Selecting fields
- Custom expression
- Inner, left outer and right outer joins
- Filtering Data
- Grouping and aggregate functions
- Sorting
- Setting aliases for the selected fields and tables
For more information on how to use these capabilites in Visual Query Designer, refer to Query Building With Visual Query Designer.
Note: You need to have Microsoft Internet Explorer 9 or higher installed on the system to run the Visual Query Designer.
See the graphic below to understand how a simple SQL query is generated in the Visual Query Designer.
- Queries for XML, Object, DataSet Provider or any other specific data providers cannot be created in Visual Query Designer.
- Unions, nested queries and stored procedures are not supported in Design Tab.
- Crosses, full joins, provider-specific joins, and other SQL-specific implementation capabilities are not supported in the Design Tab.
Accessing the Visual Query Designer
- Connect a Page/RDL Report to a data source. See Connect to a Data Source for details on how to connect to a data source in Page/Rdl Reports and Bind Reports to a Data Source for Section Reports.
- Right-click the data source node (DataSource1 by default) and select the Add Data Set option or select Data Set from the Add button on the Report Explorer toolbar to add a data set to the report.
- In the DataSet Dialog that appears, select the Query page and then select the edit with visual query designer button
 .
.
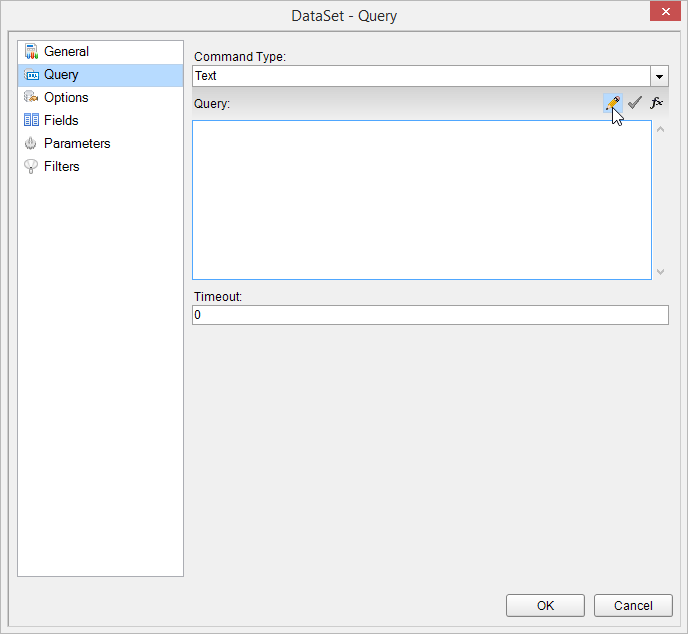
This opens the Visual Query Designer in a Page Report or Rdl Report.
In a Section Report
- Connect a Section Report to a data source through the Report Data Source dialog. The Query Designer button is disabled until the report connects to a data source. For more information see, Bind Reports to a Data Source.
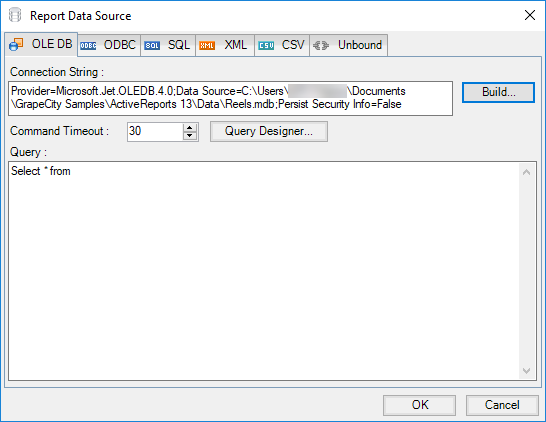
- Once enabled, click the
 button.
This opens the Visual Query Designer in a Section Report.
Elements of Visual Query Designer
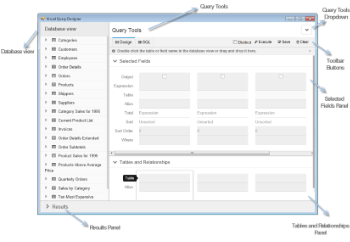
Database View
Database View contains the structure of a database including namespaces, tables, views and columns. You can drag and drop or double click the elements in the Database View to add them to the Design tab. Alternatively, you can double click the crossed arrows icon on the right hand side of each element in the Database View to add it to the Design tab.
This is the first step in query building through the Visual Query Designer. A SQL query is generated as you add the database elements to the Design tab.
Query Tools
The Visual Query Designer provides several tools to generate a query. The Query Tools section is divided into three major areas: Design tab, SQL tab and Toolbar buttons.
Design Tab
The Design tab is the area of the Visual Query Designer where you set up queries. It provides a visual interface for the SQL query you want to generate.
-
Selected Fields panel
Displays the fields, tables or any other element selected from the Database view. Each field in the Selected Fields panel has its own set of editable options.
Option Description Output Checkbox to determine whether the field is included in the result set. The checkbox is selected by default when a field is added to the Selected Fields panel. You can clear this checkbox if you do not want the field to be displayed in the Results panel.
Table Displays the name of the table the selected field belongs to. Alias Allows the user to provide an alternative name for the field. Total Applies grouping or aggregates on a field. Total (expression) is used to perform a calculation, retrieve the value of a control, define regulations, create calculated fields, and define a group level for a report.
- Expression - Allows selection of fields from a table. Custom expressions can also be specified here.
- GroupBy - Groups data based on the selected field.
- Count - Returns the number of items in a group. Implements the SQL COUNT aggregate.
- Avg - Returns the average of the values in a group. Implements the SQL AVG aggregate.
- Sum - Returns the sum of all the values in the group. Implements the SQL SUM aggregate.
- Min - Returns the minimum value in a group. Implements the SQL MIN aggregate.
- Max - Returns the maximum value in a group. Implements the SQL MAX aggregate.
- StDev - Returns the statistical standard deviation of all values in a group. Implements the SQL STDEV aggregate.
- Var - Returns the statistical variance of all values in the group. Implements the SQL VAR aggregate.
Sort Arranges data in a prescribed sequence i.e. in Ascending or Descending order. Sort Order Allows the user to set the order of sorting in case multiple fields are to be sorted. Where Allows the user to set a filtering condition for the column data. The WHERE clause can be used when you want to fetch any specific data from a table omitting other unrelated data. Note: When you add a table to the Selected Fields panel, all the fields in that table are added to the query. In effect you get a query like Select * from Customers. -
Tables and Relationships
The Tables and Relationships panel displays a list of all the tables with fields in the Selected Fields panel. In case the Selected Fields panel has fields from multiple tables, a Relations button appears at the bottom of the related table's name to show the relationship between two tables.
Tables and Relationships panel provides the following options for each table:Option Description Table Displays the names of all the tables with fields in the Selected Fields panel. Alias Allows the user to provide an alternative name for the table.
SQL Tab
The SQL Tab displays the SQL statement for the current query. Users can edit the query directly in the SQL Tab.
When you switch to the SQL Tab, the Visual Query Designer automatically formats your query in the correct syntax with highlighted keywords.
In the SQL Tab you can:
- Add new queries by directly typing SQL statements.
- Modify the SQL statement created by Visual Query Designer.
Tool Bar Buttons
| Option | Description |
|---|---|
| Distinct Checkbox | Distinct Checkbox is used to remove duplicates from the result set of a SELECT statement. If checked, it allows users to display only distinct values. |
| Execute | Allows users to execute their query and display the result in Results panel. |
| Save | Allows users to save the query to a DataSet dialog. |
| Clear | Allows users to clear all the panels in the Visual Query Designer and the SQL tab along with it. |
The Query Tools section also has a dropdown on the top right corner with two options:
- Toggle Panels: To expand or collapse the Selected Fields and the Tables and Relationships panel.
- Show Hints: To show or hide hints on how to use the Visual Query Designer effectively.
Example: "Double click the table or field name in the database view or drag and drop it here." appears at the top of the Selected Fields panel.
Result panel
Displays the result of the query set in the Visual Query Designer.
This panel is populated when you click the Execute button on the Visual Query Designer toolbar after adding the required fields or tables in the Selected Fields panel.
Go to Top