You can create a master detail report using the Table control and grouping. The following walkthrough takes you through the step by step procedure of creating a Master Detail report.
The walkthrough is split into the following activities:
- Adding an ActiveReport to a Visual Studio project
- Connecting the report to a data source
- Adding a dataset to the report
- Adding controls to the report to contain data
- Viewing the report
Note:
- This walkthrough uses the Customer table from the Reels database. By default, in ActiveReports, the Reels.mdb file is located in the [User Documents folder]\GrapeCity Samples\ActiveReports 13\Data folder.
- Although this walkthrough uses Page reports, you can also implement this using RDL reports.
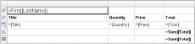
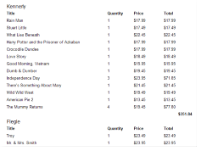
When you complete this walkthrough you get a layout that looks similar to the following at design time and at run time.
Design-Time Layout
Run-Time Layout
To add an ActiveReport to the Visual Studio project
- Create a new Visual Studio project.
- From the Project menu, select Add New Item.
- In the Add New Item dialog that appears, select ActiveReports 13 Page Report and in the Name field, rename the file as rptMasterDetail.
- Click the Add button to open a new fixed page report in the designer.
- For a $$RDL report$$, from the Report menu, select Convert to RDL Report.
See Adding an ActiveReport to a Project for information on adding different report layouts.
To connect the report to a data source
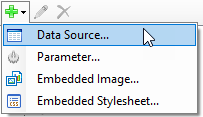
- In the Report Explorer, right-click the Data Sources node and select the Add Data Source option or select Data Source from the Add button.
- In the Report Data Source Dialog that appears, select the General page and in the Name field, enter a name like ReportData.
- On this page, create a connection to the Reels database. See Connect to a Data Source for information on connecting to a data source.
To add a dataset
- In the Report Explorer, right-click the data source node and select the Add Data Set option or select Data Set from the Add button.
- In the DataSet Dialog that appears, select the General page and enter the name of the dataset as CustomerOrders. This name appears as a child node to the data source icon in the Report Explorer.
- On the Query page of this dialog, in the Query field enter the following SQL query.
SQL Query Copy CodeSELECT CustomerID, Title, LastName, Quantity, Price, [Quantity]*[Price] AS Total FROM CustomerOrders WHERE CustomerID < 1010
- Click the Validate DataSet icon
 at the top right hand corner above the Query box to validate the query.
- Click OK to close the dialog. Your data set and queried fields appear as nodes in the Report Explorer.
To create a layout for the report
To add a table with grouping to the report
- From the toolbox, drag a Table data region onto the report design surface and go to the Properties Window to set its Location property to 0in, 1in.
- Click inside the table to display the column and row handles along the top and left sides of the table.
- To visually group the data within the report, right-click the row handle to the left of the detail row and select Insert Group.
- In the Table - Groups dialog that appears, under Expression select
=Fields!CustomerID.Value.
This groups the details from each customer. - Change the Name to Customer.
Note: You cannot change the name of a table group until you have set the expression.
- Click OK to close the dialog. The group header and footer rows are added to the table.
To add a fourth column to the table
- Select the second column and in the Properties Window, change its Width property to 0.92in.
- Select the third column and in the Properties Window, change its Width property to 1.04in.
- Select the first column and in the Properties Window, change its Width property to 3.5in.
Tip: Making some columns narrower before making other columns wider prevents your report width from changing.
- Right-click the column handle above the third column and select Insert Column to the Right. The inserted fourth column has the same width as the third column, which is 1.04in.
To add data to the table
- Place your mouse over the Textbox located in the first column of the group header row of the table to display the field selection adorner.
- Click the adorner to display the list of available fields from the DataSet and select LastName. This automatically places an expression in the group header row and simultaneously places a static label in the table header row.
- In the Properties window, set the FontSize property of this textbox to 12pt.
- In the table header row, delete the static label Last Name.
- To display static labels at the beginning of each new group, right-click the row handle to the left of the group header row and select Insert Row Below.
- In the first column of the detail row, use the field selector adorner to select the Title field.
- In the textbox immediately above it, type Title.
- In the table header row, delete the static label Title.
- In the second column of the detail row, use the field selector adorner to select the Quantity field. This automatically places an expression in the detail row and simultaneously places a static label in the header row of the same column.
- In the Properties window, set the TextAlign property of the Quantity field to Left.
- Cut the static label and paste it into the inserted row immediately above the detail row.
- In the third column of the detail row, use the field selector adorner to select the Price field.
- In the Properties window, set the following properties.
Property Name Property Value TextAlign Left Format C (uses currency formatting) - Cut the static label from the group header and paste it into the inserted row immediately above the detail row.
- Select the Total field for the fourth column of the detail row of the table.
- In the Properties window, set the following properties.
Property Name Property Value TextAlign Left Format C (uses currency formatting) - Cut the static label from the group header and paste it into the inserted row immediately above the detail row.
To refine the look of the report
- Right-click any row handle to the left of the table and select Table Header to remove the table header row since it is not being used.
- Select the Header row containing the labels by clicking the table handle to the left of the row.
- In the Properties window, set the following properties.
Property Name Property Value RepeatOnNewPage True FontWeight Bold - From the Report Explorer, drag the Total field into the group footer row in the fourth column to add subtotaling to the group. Notice that the expression automatically uses the Sum function.
- Go to the Properties window to set the following properties.
Property Name Property Value Format C (uses currency formatting) FontWeight Bold - From the Report Explorer, drag the Total field into the table footer row in the fourth column. This adds grand totaling to the table.
- Go to the Properties window to set the following properties.
Property Name Property Value Format C (uses currency formatting) FontWeight Bold - Delete the static label Total from the top row.
- In the Report Explorer select the Table data region and set its FixedSize property to 6.5in, 7in.
Note: This step is valid only for Page report. For RDL report, follow steps 10-12.
- For RDL reports, click the gray area below the design surface to give report the focus and from the Report menu, select Page Header.
- From the toolbox, drag the TextBox control onto the PageHeader section to span the entire width of the report.
- Go to the Properties Window to set the following properties.
Property Name Property Value TextAlign Center FontSize 14pt Value Customer Orders
To view the report
- Click the preview tab to view the report at design time.
OR
- Open the report in the Viewer. See Windows Forms Viewer for further information.
See Also