In a page report/RDL report, group your data from a data region on fields and expressions. Each data region provides grouping in a different way.
Use the steps below to learn how to set groups in each data region. These steps assume that you have already added a Page Report/RDL Report template and connected it to a data source. See Adding an ActiveReport to a Project, Connect to a Data Source and Add a Dataset for more information.
To set grouping in a Table
To group data in a Table data region, add group header and footer rows to the table or set detail grouping.
To add groups in a Table
- From the Visual Studio toolbox, drag and drop a Table data region onto the design surface.
- With the Table selected on the report, under the Properties window, click the Property dialog link to open the Table dialog.
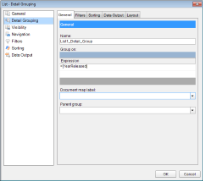
- In the table dialog that appears go to the Groups page and click the Add (+) button to add a group manually.
- In this dialog, on the General tab, under Group on enter the field name or expression on which you want to group the data. For e.g., =Fields!YearReleased.Value.
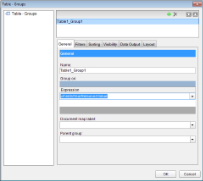 Note: A default group name like Table1_Group1 appears under Name, until you set the grouping expression under Group On, after which you can modify the group name.
 - Under the Document map label, you can optionally set a label to add the item to the document map. See Document Map for further information.
- Under Parent group, you can optionally set the parent group for a recursive hierarchy.
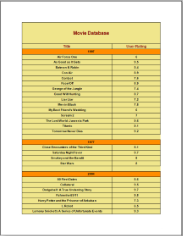
- Click OK to close the dialog. Group header and group footer rows appear right above and below the table details row.
- Drag and drop fields onto the Table data region and in the group header row, add the field on which the grouping is set.
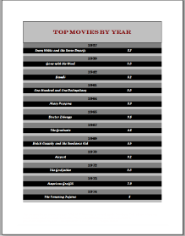
- Preview the report to see the result.
To set detail grouping in a Table
Detail Grouping is useful when you do not want to repeat values within the data on display in the report.
- From the Visual Studio toolbox, drag and drop a Table data region onto the design surface.
- With the Table selected on the report, under the Properties Window, click the Property dialog link to open the Table dialog > Detail Grouping page.
- In the Detail Grouping page, under Group on enter the expression on which you want to group the data. For e.g., =Fields!YearReleased.Value
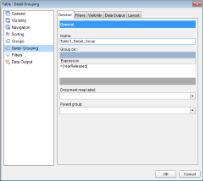 Note: A default group name like Table1_Detail_Group1 appears under Name, until you set the grouping expression under Group On, after which you can modify the group name.
 - Under the Document map label, you can optionally set a label to add the item to the document map. See Document Map for further information.
- Under Parent group, you can optionally set the parent group for a recursive hierarchy.
- Click OK to close the dialog.
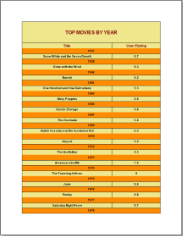
- Drag and drop fields onto the Table data region and go to the preview tab to see grouped data.
To set detail grouping in a List
To group data in a List data region, set detail grouping. Detail Grouping is useful when you do not want to repeat values within the data on display in the report.
- From the Visual Studio toolbox, drag and drop a List data region onto the design surface.
- With the List selected on the report, under the Properties window, click the Property dialog link to open the List dialog > Detail Grouping page.
- In the Detail Grouping page, under Group on enter the expression on which you want to group the data. For e.g., =Fields!YearReleased.Value.
 Note: A default group name like List1_Detail_Group appears under Name, until you set the grouping expression under Group On, after which you can modify the group name.
 - Under the Document map label field, you can optionally set a label to add the item to the document map. See Document Map for further information.
- Under the Parent group field, you can optionally set the parent group for a recursive hierarchy.
- Click OK to close the dialog.
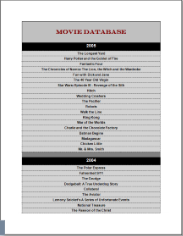
- Drag and drop fields or other data regions onto the List data region and go to the preview tab to see grouped data.
To set grouping in a BandedList
To group data in a BandedList data region, add the BandedList group header and footer row.
- From the Visual Studio toolbox, drag and drop a BandedList data region onto the design surface.
- Right-click the BandedList data region and select Insert Group to open the Banded List-Groups dialog.
OR
With the BandedList selected on the report, under the Properties Window, click the Property dialog link to open the Banded List dialog > Groups page. However, you have to click the Add (+) button and add the group manually in this case. - In the Groups page, under Group on enter the field name or expression on which you want to group the data. For e.g., =Fields!YearReleased.Value.
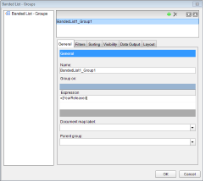 Note: A default group name like BandedList1_Group1 appears under Name, until you set the grouping expression under Group On, after which you can modify the group name.
 - Under the Document map label field, you can optionally set a label to add the item to the document map. See Document Map for further information.
- Under Parent group you can set the parent group for a recursive hierarchy.
- Click the OK to close the dialog.
- Drag and drop fields onto the BandedList data region and go to the preview tab to see grouped data.
To set grouping in a Chart
To group data in a Chart data region, set grouping for categories or series. In a Chart, you can set groups directly on the design surface or add category groups and series groups manually.
To dynamically group a Chart category or series
- From the Visual Studio toolbox, drag and drop a Chart data region onto the design surface.
- From the Report Explorer,
- Drag a field near the lower edge of the Chart and drop it onto the part that reads Drop category fields here. This action groups the categorized chart data on the field set here.
- Drag a field near the upper edge of the Chart and drop it onto the part that reads Drop data fields here. This adds data which is to be grouped to the chart.
- Drag a field near the right edge of the Chart and drop it onto the part that reads Optionally drop series fields here. This action groups data on series.
To manually group a Chart category or series
- From the Visual Studio toolbox, drag and drop a Chart data region onto the design surface.
- With the Chart data region selected on the report, under the Properties Window, click the Chart Data link to open the Chart Data dialog.
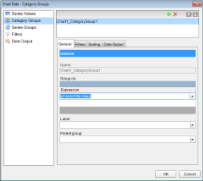
- In the Chart Data dialog, go to the Category Groups page and click the Add button to add a new group.
- Enter an expression under Group on on which you want to categorize the data. For e.g., =Fields!Title.Value.
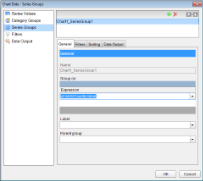
- In the Chart Data dialog, go to the Series Groups page and click the Add button to add a new group.
- Enter an expression under Group on on which you want to group your series data. For e.g., =Fields!Country.Value.
- Click OK to close the dialog.
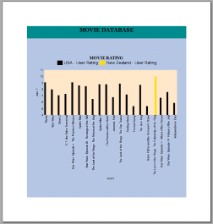
- Drag the UserRating field near the upper edge of the Chart and drop it onto the part that reads, Drop data fields here. This adds data which is to be grouped to the chart.
To set gouping in a Tablix
To group data in a Tablix data region, set row and column group expressions.
- From the Visual Studio toolbox, drag a Tablix data region and drop it onto the report design surface.
- Right-click the row or column where you want to insert a group, click Add Column Group, and select the type of grouping you want to implement. The group is added and appears in the Group Editor window.
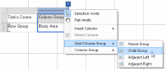
Note: By default, a Tablix data region includes a column group and a row group. For more information, see Tablix. - In the Group Editor, select the new group so that its properties display in the Properties window.
- In the Properties window, expand the Group property node and click the ellipsis button next to the GroupExpressions property to open the ExpressionDesigner Collection Editor.
- In the ExpressionDesigner Collection Editor that appears, click Add to create a new group hierarchy member.
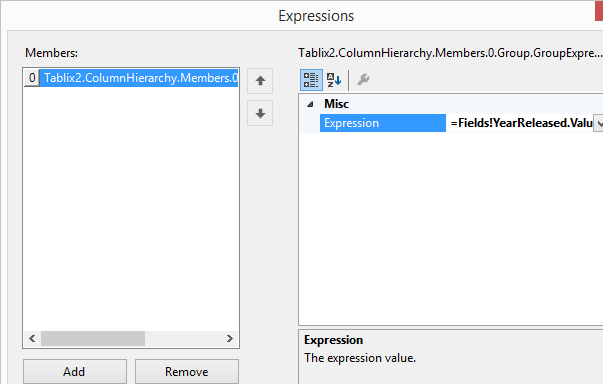
- Select the group member from the Members list and in the property grid to the right, enter an expression to group the data. For example: =Fields!YearReleased.Value
- Click OK to close the dialog.
- Drag and drop fields in the body area (bottom right corner) of the Tablix data region and go to the Preview Tab to view the result.