Given below is the list of 3D charts that fall under the Bar Chart category.
Bar Chart
In a Bar Chart, values are represented by the height of the bar shaped marker as measured by the y-axis. Category labels are displayed on the x-axis. Use a 3D bar chart to compare values of items across categories, allowing the data to be viewed in a convenient 3D format.
|
|
|
|---|---|
| ChartType | Bar3D |
| Number of Y values per data point | 1 |
| Number of Series | 1 or more |
| Marker Support | Series or Data Point |
| Custom Properties | The BarTopPercent property gets or sets the percentage of the top of the bar that is shown for Cone or Custom BarTypes. The BarType property gets or sets the type of bars that is displayed.Use BarType enumeration value. The Gap property gets or sets the space between the bars of each X axis value. The RotationAngle propertygets or sets the starting horizontal angle for custom 3D bar shapes. Can only be used with the Custom BarType. The VertexNumber property gets or sets the number of vertices for the data point, used to create custom 3D bar shapes. Can only be used with the Custom BarType. Bars must contain 3 or more vertices. |
Gantt Chart
The 3D gantt chart displays a gantt chart in 3D.
|
Chart Information |
|
|---|---|
| ChartType | Bar3D |
| Number of Y values per data point | 2 |
| Number of Series | 1 or more |
| Marker Support | Series or Data Point |
| Custom Properties | The BarTopPercent property gets or sets the percentage of the top of the bar that is shown for Cone or Custom BarTypes. The BarType property gets or sets the type of bars that are displayed. Use BarType enumeration value. The Gap property gets or sets the space between the bars of each X axis value. The VertexNumber property gets or sets the number of vertices for the data point, used to create custom 3D bar shapes. Can only be used with the Custom BarType. Bars must contain 3 or more vertices. |
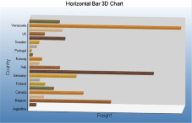
Horizontal Bar Chart
In a Horizontal Bar Chart, both the axes are swapped and therefore the bars appears horizontally. Although, values are represented by the height of the bar shaped marker as measured by the y-axis and the Category labels are displayed on the x-axis. Use a horizontal 3D bar chart to compare values of items across categories, allowing the data to be viewed in a convenient 3D format.
|
Chart Information |
|
|---|---|
| ChartType | Bar3D |
| Number of Y values per data point | 1 |
| Number of Series | 1 or more |
| Marker Support | Series or Data Point |
| Custom Properties | The BarTopPercent property gets or sets the percentage of the top of the bar that is shown for Cone or Custom BarTypes. The BarType propertygets or sets the type of bars that is displayed. Use BarType enumeration value. The Gap property gets or sets the space between the bars of each X axis value. The RotationAngle property gets or sets the starting horizontal angle for custom 3D bar shapes. Can only be used with the Custom BarType. The VertexNumber property gets or sets the number of vertices for the data point, used to create custom 3D bar shapes. Can only be used with the Custom BarType. Bars must contain 3 or more vertices. |
Below is an example of how to set the custom chart properties at run time for a horizontal 3D bar chart as shown above.
| Visual Basic |
Copy Code
|
|---|---|
| Me.ChartControl1.Series(0).Properties("BarTopPercent") = 80.0F Me.ChartControl1.Series(0).Properties("BarType") = GrapeCity.ActiveReports.Chart.BarType.Custom Me.ChartControl1.Series(0).Properties("Gap") = 65.0F Me.ChartControl1.Series(0).Properties("PointBarDepth") = 100.0F Me.ChartControl1.Series(0).Properties("RotationAngle") = 0.0F Me.ChartControl1.Series(0).Properties("VertexNumber") = 6 |
|
| C# |
Copy Code
|
|---|---|
| this.ChartControl1.Series[0].Properties["BarTopPercent"] = 80f; this.ChartControl1.Series[0].Properties["BarType"] = GrapeCity.ActiveReports.Chart.BarType.Custom; this.ChartControl1.Series[0].Properties["Gap"] = 65f; this.ChartControl1.Series[0].Properties["PointBarDepth"] = 100.0f; this.ChartControl1.Series[0].Properties["RotationAngle"] = 0f; this.ChartControl1.Series[0].Properties["VertexNumber"] = 6; |
|
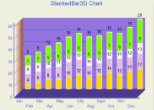
Stacked Bar Chart
Use a 3D bar graph to compare values of items across categories, allowing the data to be viewed conveniently in a 3D format. A stacked bar graph is a bar graph with two or more data series stacked on top of each other. Use this graph to show how each value contributes to a total.
|
|
|
|---|---|
| ChartType | Bar3D |
| Number of Y values per data point | 1 |
| Number of Series | 1 or more |
| Marker Support | Series or Data Point |
| Custom Properties | The BarTopPercent property gets or sets the percentage of the top of the bar that is shown for Cone or Custom BarTypes. The BarType property gets or sets the type of bars that are displayed. Use BarType enumeration value. The Gap property gets or sets the space between the bars of each X axis value. The VertexNumber property gets or sets the number of vertices for the data point, used to create custom 3D bar shapes. Can only be used with the Custom BarType. Bars must contain 3 or more vertices. |
Below is an example of how to set the custom chart properties at run time for a StackedBar3D chart.
| Visual Basic |
Copy Code
|
|---|---|
| Me.ChartControl1.Series(0).Properties("BarTopPercent") = 80.0F Me.ChartControl1.Series(0).Properties("BarType") = GrapeCity.ActiveReports.Chart.BarType.Custom Me.ChartControl1.Series(0).Properties("Gap") = 65.0F Me.ChartControl1.Series(0).Properties("VertexNumber") = 6 |
|
| C# |
Copy Code
|
|---|---|
| this.ChartControl1.Series[0].Properties["BarTopPercent"] = 100f; this.ChartControl1.Series[0].Properties["BarType"] = GrapeCity.ActiveReports.Chart.BarType.Custom; this.ChartControl1.Series[0].Properties["Gap"] = 65f; this.ChartControl1.Series[0].Properties["VertexNumber"] = 6 |
|
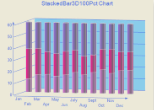
Stacked Bar Chart 100%
A Stacked Bar 3D 100% chart is a bar chart with two or more data series in 3D stacked one on top of the other to sum up to 100%. Use this chart to show how each value contributes to a total with the relative size of each series representing its contribution to the total.
|
|
|
|---|---|
| ChartType | Bar3D |
| Number of Y values per data point | 1 |
| Number of Series | 1 or more |
| Marker Support | Series or Data Point |
| Custom Properties |
The BarTopPercent property gets or sets the percentage of the top of the bar that is shown for Cone or Custom BarTypes. The BarType property gets or sets the type of bars that are displayed. Use BarType enumeration value. The VertexNumber property gets or sets the number of vertices for the data point, used to create custom 3D bar shapes. Can only be used with the Custom BarType. Bars must contain 3 or more vertices. |
Below is an example of how to set the custom chart properties at run time for a StackedBar3D100Pct chart.
| Visual Basic |
Copy Code
|
|---|---|
| Me.ChartControl1.Series(0).Properties("BarTopPercent") = 80.0F Me.ChartControl1.Series(0).Properties("BarType") = GrapeCity.ActiveReports.Chart.BarType.Custom Me.ChartControl1.Series(0).Properties("Gap") = 65.0F Me.ChartControl1.Series(0).Properties("VertexNumber") = 6 |
|
| C# |
Copy Code
|
|---|---|
| this.ChartControl1.Series[0].Properties["BarTopPercent"] = 100f; this.ChartControl1.Series[0].Properties["BarType"] = GrapeCity.ActiveReports.Chart.BarType.Custom; this.ChartControl1.Series[0].Properties["Gap"] = 65f; this.ChartControl1.Series[0].Properties["VertexNumber"] = 6 |
|
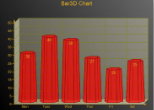
Bar/Cylinder Chart
It is almost similar to a bar chart and values are represented by the height of the bar shaped marker as measured by the y-axis. Category labels are displayed on the x-axis. The only difference is that in a Bar/Cylinder Chart the data is represented through cylindrical shaped markers.
|
Chart Information |
|
|---|---|
| ChartType | Bar3D |
| Number of Y values per data point | 1 |
| Number of Series | 1 or more |
| Marker Support | Series or Data Point |
| Custom Properties | The BarTopPercent property gets or sets the percentage of the top of the bar that is shown for Cone or Custom BarTypes. The BarType property gets or sets the type of bars that is displayed. Use BarType enumeration value. The Gap property gets or sets the space between the bars of each X axis value. The RotationAngle property gets or sets the starting horizontal angle for custom 3D bar shapes. Can only be used with the Custom BarType. The VertexNumber property gets or sets the number of vertices for the data point, used to create custom 3D bar shapes. Can only be used with the Custom BarType. Bars must contain 3 or more vertices. |
Bar/Pyramid Chart
In a Bar/Pyramid Chart the data is represented through pyramid shaped bars and values are represented by the height of the bars as measured by the y-axis. Category labels are displayed on the x-axis.
|
Chart Information |
|
|---|---|
| ChartType | Bar3D |
| Number of Y values per data point | 1 |
| Number of Series | 1 or more |
| Marker Support | Series or Data Point |
| Custom Properties | The BarTopPercent property gets or sets the percentage of the top of the bar that is shown for Cone or Custom BarTypes. The BarType property gets or sets the type of bars that is displayed. Use BarType enumeration value. The Gap property gets or sets the space between the bars of each X axis value. The RotationAngle property gets or sets the starting horizontal angle for custom 3D bar shapes. Can only be used with the Custom BarType. The VertexNumber property gets or sets the number of vertices for the data point, used to create custom 3D bar shapes. Can only be used with the Custom BarType. Bars must contain 3 or more vertices. |
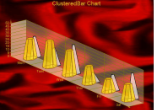
Clustered Bar chart
Use a 3D clustered bar chart to compare values of items across categories, allowing the data to be viewed in a convenient 3D format.
|
|
|
|---|---|
| ChartType | Bar3D |
| Number of Y values per data point | 1 |
| Number of Series | 1 or more |
| Marker Support | Series or Data Point |
| Custom Properties | The BarTopPercent property gets or sets the percentage of the top of the bar that is shown for Cone or Custom BarTypes. The BarType property gets or sets the type of bars that are displayed. Use BarType enumeration value. The Gap property gets or sets the space between the bars of each X axis value. The RotationAngle property gets or sets the starting horizontal angle for custom 3D bar shapes. Can only be used with the Custom BarType. The VertexNumber property gets or sets the number of vertices for the data point, used to create custom 3D bar shapes. Can only be used with the Custom BarType. Bars must contain 3 or more vertices. |
Below is an example of how to set the custom chart properties at run time for a 3D clustered bar chart as shown above.
| Visual Basic |
Copy Code
|
|---|---|
' set the custom properties for series 1.
Me.ChartControl1.Series(0).Properties("BarTopPercent") = 50.0F
Me.ChartControl1.Series(0).Properties("BarType") = GrapeCity.ActiveReports.Chart.BarType.Custom
Me.ChartControl1.Series(0).Properties("Gap") = 300.0F
Me.ChartControl1.Series(0).Properties("RotationAngle") = 0.0F
Me.ChartControl1.Series(0).Properties("VertexNumber") = 6

' set the custom properties for series 2.
Me.ChartControl1.Series(1).Properties("BarTopPercent") = 20.0F
Me.ChartControl1.Series(1).Properties("BarType") = GrapeCity.ActiveReports.Chart.BarType.Custom
Me.ChartControl1.Series(1).Properties("Gap") = 300.0F
Me.ChartControl1.Series(1).Properties("RotationAngle") = 90.0F
Me.ChartControl1.Series(1).Properties("VertexNumber") = 3
|
|
| C# |
Copy Code
|
|---|---|
// set the custom properties for series 1. this.ChartControl1.Series[0].Properties["BarTopPercent"] = 50f; this.ChartControl1.Series[0].Properties["BarType"] = GrapeCity.ActiveReports.Chart.BarType.Custom; this.ChartControl1.Series[0].Properties["RotationAngle"] = 0f; this.ChartControl1.Series[0].Properties["VertexNumber"] = 6; // set the custom properties for series 2. this.ChartControl1.Series[1].Properties["BarTopPercent"] = 20f; this.ChartControl1.Series[1].Properties["BarType"] = GrapeCity.ActiveReports.Chart.BarType.Custom; this.ChartControl1.Series[1].Properties["Gap"] = 300f; this.ChartControl1.Series[1].Properties["RotationAngle"] = 90f; this.ChartControl1.Series[1].Properties["VertexNumber"] = 3; |
|