Given below is the list of 2D charts that fall under the Financial Chart category.
Candle Stick Chart
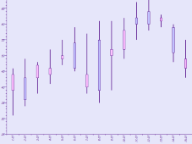
A candle chart displays stock information, using High, Low, Open and Close values. The size of the wick line is determined by the High and Low values, while the size of the bar is determined by the Open and Close values. The bar is displayed using different colors, depending on whether the price of the stock has gone up or down.
|
|
|
|---|---|
| ChartType | Financial2D |
| Number of Y values per data point | 4 (The first value is the high figure, the second is the low figure, the third is the opening figure, and the fourth is the closing figure.) |
| Number of Series | 1 or more |
| Marker Support | Series or Data Point. Marker labels use the first Y value as the default value. |
| Custom Properties | The BodyDownswingBackdrop property gets or sets the backdrop information used to fill the rectangle for data points in which the closing figure is lower than the opening figure. The BodyUpswingBackdrop property gets or sets the backdrop information used to fill the rectangle for data points in which the closing figure is higher than the opening figure. The BodyWidth property gets or sets the width of the rectangle used to show upswing or downswing. The WickLine property gets or sets the line information for the wick line. |
Below is an example of how to set the custom chart properties at run time for a candle chart as shown in the image above.
To write the code in Visual Basic.NET
| Visual Basic |
Copy Code
|
|---|---|
Imports GrapeCity.ActiveReports.Chart.Graphics |
|
| Visual Basic |
Copy Code
|
|---|---|
With Me.ChartControl1.Series(0)
.Properties("BodyDownswingBackdrop") = New Chart.Graphics.Backdrop(Color.FromArgb(255, 192, 255))
.Properties("BodyUpswingBackdrop") = New Chart.Graphics.Backdrop(Color.FromArgb(192, 192, 255))
.Properties("WickLine") = New Chart.Graphics.Line(Color.Indigo)
.Properties("BodyWidth") = 7.0F
End With
|
|
To write the code in C#
| C# code |
Copy Code
|
|---|---|
Using GrapeCity.ActiveReports.Chart.Graphics |
|
| C# Code |
Copy Code
|
|---|---|
this.ChartControl1.Series[0].Properties["BodyDownswingBackdrop"]= new Chart.Graphics.Backdrop
(Color.FromArgb(255, 192, 255));
this.ChartControl1.Series[0].Properties["BodyUpswingBackdrop"] = new Chart.Graphics.Backdrop
(Color.FromArgb(192, 192, 255));
this.ChartControl1.Series(0).Properties("WickLine") = new Chart.Graphics.Line(Color.Indigo);
this.ChartControl1.Series[0].Properties["BodyWidth"] = 7f;
|
|
HiLo Chart
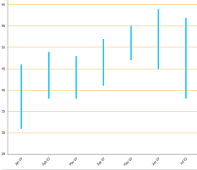
A HiLo chart displays stock information using High and Low, or Open and Close, values. The length of the HiLo line is determined by the High and Low values, or the Open and Close values.
|
|
|
|---|---|
| ChartType | Financial2D |
| Number of Y values per data point | 2 |
| Number of Series | 1 or more |
| Marker Support | Series or Data Point. Marker labels use the first Y value as the default value. |
| Custom Properties | The HiloLine property gets or sets the line information for the HiLo line. |
Below is an example of how to set the custom chart properties at run time for a HiLo chart as shown in the image above.
To write the code in Visual Basic.NET
| Visual Basic |
Copy Code
|
|---|---|
Me.ChartControl1.Series(0).Properties("HiloLine") = New GrapeCity.ActiveReports.Chart.Graphics.Line(Color.DeepSkyBlue, 4)
|
|
To write the code in C#
| C# |
Copy Code
|
|---|---|
this.ChartControl1.Series[0].Properties["HiloLine"] = new GrapeCity.ActiveReports.Chart.Graphics.Line(Color.DeepSkyBlue, 4); |
|
Point and Figure Chart
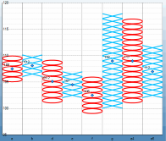
The point and figure chart uses stacked columns of X's to indicate that demand exceeds supply and columns of O's to indicate that supply exceeds demand to define pricing trends. A new X or O is added to the chart if the price moves higher or lower than the BoxSize value. A new column is added when the price reverses to the level of the BoxSize value multiplied by the ReversalAmount. The use of these values in the point and figure chart to calculate pricing trends makes this chart best suited for long-term financial analysis.
|
|
|
|---|---|
| ChartType | Financial2D |
| Number of Y values per data point | 2 |
| Number of Series | 1 or more |
| Marker Support | Series or Data Points |
| Custom Properties | The BoxSize property gets or sets the amount a price must change in order to create another X or O. The DownswingLine property gets or sets the style and color settings for the downswing O's. The ReversalAmount property gets or sets the amount that a price must shift in order for a new column to be added. The UpswingLine property gets or sets the style and color settings for the upswing X's. |
Below is an example of how to set the custom chart properties at run time for a Point and Figure chart.
To write the code in Visual Basic.NET
| Visual Basic |
Copy Code
|
|---|---|
Imports GrapeCity.ActiveReports.Chart.Graphics |
|
| Visual Basic |
Copy Code
|
|---|---|
With Me.ChartControl1.Series(0)
    .Properties("DownswingLine") = New Chart.Graphics.Line(Color.Red)
    .Properties("UpswingLine") = New Chart.Graphics.Line(Color.Blue)
    .Properties("BoxSize") = 3.0F
End With
|
|
To write the code in C#
| C# |
Copy Code
|
|---|---|
using GrapeCity.ActiveReports.Chart.Graphics; |
|
| C# |
Copy Code
|
|---|---|
this.ChartControl1.Series[0].Properties["DownswingLine"] = new Chart.Graphics.Line(Color.Red); this.ChartControl1.Series[0].Properties["UpswingLine"] = new Chart.Graphics.Line(Color.Blue); this.ChartControl1.Series[0].Properties["BoxSize"] = 3f; |
|
Renko Chart
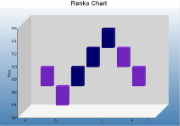
The Renko chart uses bricks of uniform size to chart price movement. When a price moves to a greater or lesser value than the preset BoxSize value required to draw a new brick, a new brick is drawn in the succeeding column. The change in box color and direction signifies a trend reversal.
|
|
|
|---|---|
| ChartType | Financial2D |
| Number of Y values per data point | 1 |
| Number of Series | 1 or more |
| Marker Support | Series or Data Points |
| Custom Properties | The BodyDownswingBackdrop property gets or sets the style and color settings for the downswing bricks. The BodyUpswingBackdrop property gets or sets the style and color settings for the upswing bricks. The BoxSize property gets or sets the amount a price must change in order to create another brick. |
Below is an example of how to set the custom chart properties at run time for a Renko chart.
To write the code in Visual Basic.NET
| Visual Basic |
Copy Code
|
|---|---|
Imports GrapeCity.ActiveReports.Chart.Graphics |
|
| Visual Basic |
Copy Code
|
|---|---|
With Me.ChartControl1.Series(0)
    .Properties("BodyDownswingBackdrop") = New Backdrop(Color.BlueViolet)
    .Properties("BodyUpswingBackdrop") = New Backdrop(Color.Navy)
    .Properties("BoxSize") = 3.0F
End With
|
|
To write the code in C#
| CS |
Copy Code
|
|---|---|
using GrapeCity.ActiveReports.Chart.Graphics; |
|
| CS |
Copy Code
|
|---|---|
this.ChartControl1.Series[0].Properties["BodyDownswingBackdrop"] = new Backdrop(Color.BlueViolet); this.ChartControl1.Series[0].Properties["BodyUpswingBackdrop"] = new Backdrop(Color.Navy); this.ChartControl1.Series[0].Properties["BoxSize"] = 3f; |
|
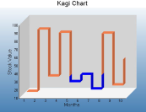
Kagi Chart
A Kagi chart displays supply and demand trends using a sequence of linked vertical lines. The thickness and direction of the lines vary depending on the price movement. If closing prices go in the direction of the previous Kagi line, then that Kagi line is extended. However, if the closing price reverses by the preset reversal amount, a new Kagi line is charted in the next column in the opposite direction. Thin lines indicate that the price breaks the previous low (supply) while thick lines indicate that the price breaks the previous high (demand).
|
|
|
|---|---|
| ChartType | Financial2D |
| Number of Y values per data point | 1 |
| Number of Series | 1 |
| Marker Support | Series or Data Points |
| Custom Properties | The DownswingLine property gets or sets the style and color settings to use for a Kagi line which charts a price decrease. The ReversalAmount property gets or sets the amount that a price must shift in order for the Kagi line to change direction. The UpswingLine property gets or sets the style and color settings to use for a Kagi line which charts a price increase. |
Below is an example of how to set the custom chart properties at run time for a Kagi chart.
To write code in Visual Basic.NET
| Visual Basic |
Copy Code
|
|---|---|
Imports GrapeCity.ActiveReports.Chart.Graphics |
|
| Visual Basic |
Copy Code
|
|---|---|
With Me.ChartControl1.Series(0)
    .Properties("BodyDownswingBackdrop") = New Backdrop(Color.Red)
    .Properties("BodyUpswingBackdrop") = New Backdrop(Color.Blue)
    .Properties("DownswingLine") = New Chart.Graphics.Line(Color.DarkRed)
    .Properties("ReversalAmount") = "25"
    .Properties("UpswingLine") = New Chart.Graphics.Line(Color.DarkBlue)
    .Properties("Width") = 50.0F
End With
|
|
To write code in C#
| C# |
Copy Code
|
|---|---|
using GrapeCity.ActiveReports.Chart.Graphics; |
|
| C# |
Copy Code
|
|---|---|
this.ChartControl1.Series[0].Properties["BodyDownswingBackdrop"] = new Backdrop(Color.Red); this.ChartControl1.Series[0].Properties["BodyUpswingBackdrop"] = new Backdrop(Color.Blue); this.ChartControl1.Series[0].Properties["DownswingLine"] = new Chart.Graphics.Line(Color.DarkRed); this.ChartControl1.Series[0].Properties["ReversalAmount"] = "25"; this.ChartControl1.Series[0].Properties["UpswingLine"] = new Chart.Graphics.Line(Color.DarkBlue); this.ChartControl1.Series[0].Properties["Width"] = 50f; |
|
Stock Chart
In a stock chart, series are displayed as a set of lines with markers for high, low, close, and open values. Values are represented by the height of the marker as measured by the y-axis. Category labels are displayed on the x-axis.
Stock chart is a visual representation of data related to the stock market. It may be used to represent data like stock prices and stock activities.
|
|
|
|---|---|
| ChartType | Financial2D |
| Number of Y values per data point | 4 |
| Number of Series | 1 or more |
| Marker Support | Series or Data Point |
| Custom Properties | The CloseLine property gets or sets the information for the close value line. The HiLoLine property gets or sets the line information for the HiLo line. The OpenLine property property gets or sets the information for the open value line. The TickLen property property gets or sets the tick length for the close value and open value lines. |
Stock Close Only Chart
A Stock chart is a visual representation of data related to the stock market. This type of chart requires four series of values in the correct order (open, high, low, and then close).
|
|
|
|---|---|
| ChartType | Financial2D |
| Number of Y values per data point | 4 |
| Number of Series | 1 or more |
| Marker Support | Series or Data Point |
| Custom Properties | The CloseLine property gets or sets the information for the close value line. The HiLoLine property gets or sets the line information for the HiLo line. The OpenLine property property gets or sets the information for the open value line. The TickLen property property gets or sets the tick length for the close value and open value lines. |
Stock Open Only Chart
A Stock chart is a visual representation of data related to the stock market. This type of chart requires four series of values in the correct order (open, high, low, and then close), low, and then close).
|
|
|
|---|---|
| ChartType | Financial2D |
| Number of Y values per data point | 4 |
| Number of Series | 3 |
| Marker Support | Series or Data Point |
| Custom Properties | The CloseLine property gets or sets the information for the close value line. The HiLoLine property gets or sets the line information for the HiLo line. The OpenLine property property gets or sets the information for the open value line. The TickLen property property gets or sets the tick length for the close value and open value lines. |
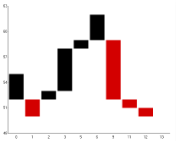
Three Line Break Chart
A Three Line Break chart uses vertical boxes or lines to illustrate price changes of an asset or market. Movements are depicted with box colors and styles; movements that continue the trend of the previous box paint similarly while movements that trend oppositely are indicated with a different color and/or style. The opposite trend is only drawn if its value exceeds the extreme value of the previous three boxes or lines. The below Three Line Break depicts upward pricing movement with black boxes and downward pricing movement with red boxes.
|
|
|
|---|---|
| ChartType | Financial2D |
| Number of Y values per data point | 1 |
| Number of Series | 1 |
| Marker Support | Series or Data Points |
| Chart-Specific Properties | The BodyDownswingBackdrop property gets or sets the style and color settings for the downswing boxes. The BodyUpswingBackdrop property gets or sets the style and color settings for the upswing boxes. The NewLineBreak property gets or sets the number of previous boxes/lines that must be compared before a new box/line is drawn. The default value is 3. |
Below is an example of how to set the custom chart properties at run time for a Three Line Break chart.
To write code in Visual Basic.NET
| Visual Basic |
Copy Code
|
|---|---|
Imports GrapeCity.ActiveReports.Chart.Graphics |
|
| Visual Basic |
Copy Code
|
|---|---|
With Me.ChartControl1.Series(0)
    .Properties("BodyDownswingBackdrop") = New Backdrop(Color.Red)
    .Properties("BodyUpswingBackdrop") = New Backdrop(Color.Black)
    .Properties("NewLineBreak") = 3
End With
|
|
To write code in C#
| C# |
Copy Code
|
|---|---|
using GrapeCity.ActiveReports.Chart.Graphics; |
|
| C# |
Copy Code
|
|---|---|
this.ChartControl1.Series[0].Properties["BodyDownswingBackdrop"] = new Backdrop(Color.Red); this.ChartControl1.Series[0].Properties["BodyUpswingBackdrop"] = new Backdrop(Color.Black); this.ChartControl1.Series[0].Properties["NewLineBreak"] = 3; |
|