Given below is the list of 2D charts that fall under the Area Chart category:
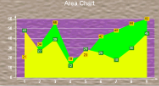
Area Chart
An area chart is used to compare trends over a period of time or across categories.
|
Chart Information |
|
|---|---|
| ChartType | Area2D |
| Number of Y values per data point | 1 |
| Number of Series | 1 or more |
| Marker Support | Series or Data Point |
| Custom Properties | None |
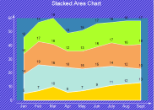
Stacked Area Chart
A stacked area chart is an area chart with two or more data series stacked one on top of the other. Use this chart to show how each value contributes to a total.
|
Chart Information |
|
|---|---|
| ChartType | Area2D |
| Number of Y values per data point | 1 |
| Number of Series | 1 or more |
| Marker Support | Series or Data Point |
| Custom Properties | None |
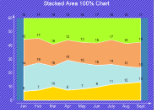
Stacked Area 100% Chart
A stacked area chart (100%) is an 100% area chart with two or more data series stacked one on top of the other. Use this chart to show how each value contributes to a total.
|
Chart Information |
|
|---|---|
| ChartType | Area2D |
| Number of Y values per data point | 1 |
| Number of Series | 1 or more |
| Marker Support | Series or Data Point |
| Custom Properties | None |
See Also