You can enhance the interactivity in your report by adding drill-through links to it using Jump to Report property. A drill-through link takes you to another report with more detail. Drill-through links appear as a hyperlink that you can click to move to a completely different report. Drill-through links are displayed when you preview your report.
What You Will Learn
This tutorial guides you through the steps to create a dashboard report.
Note: You need to complete Tutorial 6.1: Create a Simple Report with Chart before performing following steps.
After you complete this tutorial, you will have a chart report where you can navigate to another report on clicking a series value on chart area.
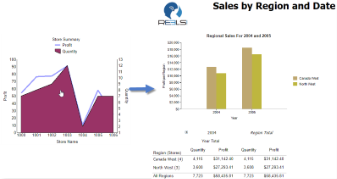
Chart with Drill-through
Add the Drill-Through Link
- From the Explorer
 , select the Chart data region.
 - Select Profit in the Data Fields area.
- In the Properties pane, go to the Action group of properties and set Type to Jump to Report.
- In the Jump to Report field that appears, select a report from the list that you want to jump to on clicking the plot of Profit. For example, we have selected 'Sales By Region' report available in the ActiveReports Server.
- Similarly, select Quantity in the Data Fields area.
- Repeat steps 2 and 3. In the Jump to Report property, select 'Store Report'.
Preview and Save Report
- Click Preview
 to view your report in the final output.
 - Click a series on the plot area. You will see that you are navigated to that report.
- Exit the preview mode by clicking Back on the top left side of the designer.
- Switch to the File tab and click Save to open the Save dialog box. Enter the report name and click Save Report. You can also provide a description and a revision comment for the report.
See Also