A simple Pivot report contains a Tablix data region. This report uses the default row and column groups to display data.
What You Will Learn
This tutorial guides you through the steps to create a simple Pivot report using Tablix data region.
- Access the ActiveReports Web Designer and Add Data Set
- Create Report Layout
- Bind Data to Tablix Data Region
- Add Labels to Tablix Data Region
- Manage Data
- Add Report Title
- Customize the Appearance of the Pivot Report
- Preview and Save Report
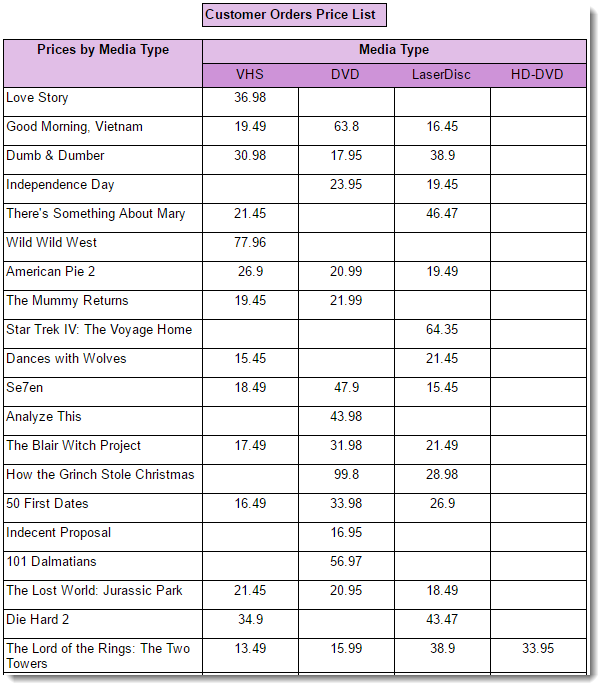
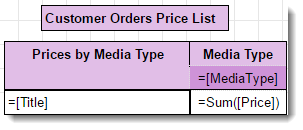
After you complete this tutorial, you will have a report that looks similar to the following.
Access the ActiveReports Web Designer and Add Data Set
- On the ActiveReports Server Report Portal, click Create report.
The ActiveReports Web Designer opens in the new browser tab. - Select Blank RDL Report template and then click Choose Data.
- Select CustomerOrders data set from the available shared data sets.
- Click Create Report. The CustomerOrders data set is added to the report.
Create Report Layout
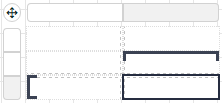
Drag and drop Tablix data region  onto the design area of the report.
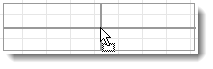
You see a row group area and a column group area as shown.
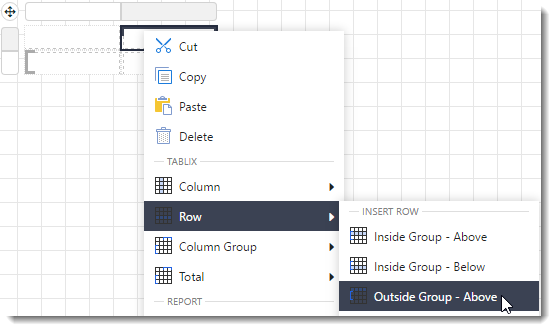
To add a static row to display labels (static text) for the column group,
- Right-click the column group area to view the options in the context menu.
- Go to Row and select Outside Group - Above.
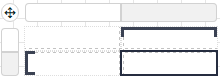
Now the tablix in the design area looks as shown.
Bind Data to Tablix Data Region
Let us now populate the Tablix data region with data. We want the titles to be displayed along the rows, different media types along the columns, and the total price corresponding to these.
- Click the drop down next to the CustomerOrders data set to view fields in the added data set.
- Drag and drop the Title field onto the row group area as shown.
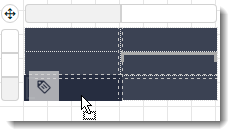
- Drag and drop the MediaType field on the column group.
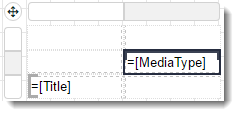
- Similarly, drag and drop the Price field onto the body of the tablix.
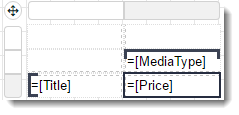
To display the aggregate price for the media types,
- Select the body area containing Price field.
- Go to Properties pane and select the radio button next to Value property.
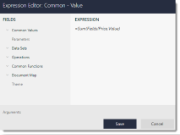
- Select Expressions... from the drop down and enter the following expression in the Expression Editor:
=Sum(Fields!Price.Value).
Add Labels to Tablix Data Region
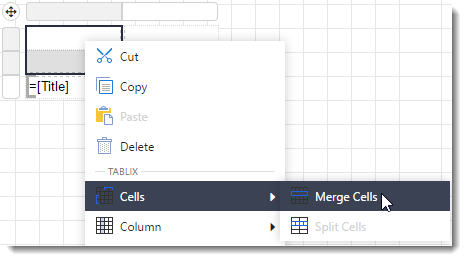
To merge the cells in the tablix corner area (top left),
- Select the cells in the tablix corner area using mouse drag or simply using Ctrl+Click combination.
- Right-click the selected cells to view the options in the context menu, go to Cells, and select Merge Cells.
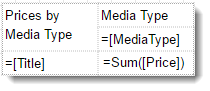
To provide labels to the columns,
- Enter text 'Prices by Media Type'.
- Select the text box above the column group MediaType and enter the text 'Media Type'.
Now the tablix has column labels as shown.
Manage Data
In Tablix data region, you need to manage how a grouped data is rendered across the rows and columns. This is done by using Group Expressions as explained below.
- From the Explorer
 , select the Tablix data region.
 - Click the Group Editor icon
 to display row groups and column groups.
To display the titles once for every row group:
- Select Title (Tablix1_RowGroup1) row group and go to the Properties pane.
- In the Group Expressions property, click Show Items and then select Add Item.
- Click the radio button to display the fields and select the Title field.
To display the media types once for every column group:
- Select MediaType (Tablix1_ColumnGroup1) column group and go to the Properties pane.
- In the Group Expressions property, click Show Items and then select Add Item.
- Click the radio button to display the fields and select the MediaType field.
Add Report Title
- Drag and drop a TextBox control
 above the tablix. If required, relocate the tablix to create space for the text box.
 - Click inside the text box and enter the text 'Customer Orders Price List'.
Customize the Appearance of the Pivot Report
Note: You may need to resize and reposition the controls on the report to accommodate data, and for a cleaner look.
- To apply borders to tablix, select the Tablix data region and set the BORDER - Style property to Solid.
- To customize the static row of the tablix and the title of the report, set the following properties for text boxes with text 'Prices by Media Type', 'Media Type', and 'Customer Orders Price List'.
Property Value BACKGROUND - Color Plum TEXT - Font Weight Bold TEXT - Text Align Center BORDER - Style Solid - To customize the body area and group area of the tablix, set the following properties.
Property Value Body area (=Sum([Price])) BORDER - Style Solid TEXT - Text Align Center Row group area (=[Title]) BORDER - Style Solid Column group area (=[MediaType]) TEXT - Text Align Center BACKGROUND - Color MediumOrchid
Preview and Save Report
- Click Preview
 to view your report in the final output.
 - Exit the preview mode by clicking Back on the top left side of the designer.
- Switch to the File tab and click Save to open the Save dialog box. Enter the report name and click Save Report. You can also provide a description and a revision comment for the report.