A Tablix data region displays data in cells that are arranged in rows and columns. It provides enhanced layout capabilities ranging from creation of simple tables to advanced matrices. Tablix is essentially a combination of two data regions, the table and the matrix. Therefore, it provides all the features of a table and a matrix along with added capabilities including support for multiple adjacent groups on rows or columns and improved layout flexibility with stepped group layouts.
You can also choose to set the height of multiple rows or width of multiple columns using Distribute Rows Evenly and Distribute Columns Evenly options from the context menu of the Tablix data region. You can select multiple rows or columns using the Ctrl key and mouse click together or by simply dragging the mouse over rows and columns.
You can even freeze row and column headers in RDL reports in the HTML5 Viewer. For more information, see Freeze Rows and Columns.
This topic describes how the elements of the Tablix data region work together and explains its basic operations.
Areas of the Tablix Data Region
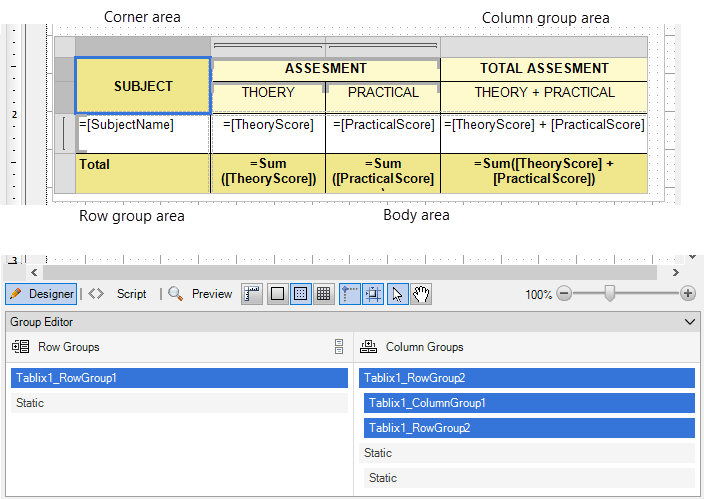
The Tablix data region is composed of four areas denoted by dotted lines on the design surface: the corner, the row group area, the column group area, and the body. By default, each tablix cell contains a TextBox control and the function for each cell is determined by its location. You can change the layout of the Tablix data region using the LayoutDirection property.
ActiveReports includes a Group Editor window that is specifically designed to manage the tablix structure. In the Visual Studio integrated designer as well as in applications using the Designer control, the Group Editor window is located below the report design surface. Developers can use it in custom designer applications as well.
Note: In case the Group Editor window does not appear automatically in your application, select View > Other Windows > Group Editor 12 in your Visual Studio project.
The image below demonstrates the areas of a Tablix data region, where column groups are set to TheoryScore and PracticalScore, and the row group is set to SubjectName.
The Group Editor window contains the following groups:
- Row Groups: The Row Groups section in the Group Editor displays all the groups that are applied in the row group area of the Tablix data region.
Subject
The left center cell of the Tablix data region =[SubjectName] represents the Subject group in the Group Editor window. This group displays the subject names for the current semester.
-
Column Groups : The Column Groups section in the Group Editor window displays all the groups that are applied in the column group area of the Tablix data region.
Theory
The center left cell of the Tablix data region =[TheoryScore] represents the Theory group in the Group Editor window. This group displays theory scores for the student in each subject.Practical
The center right cell of the Tablix data region =[PracticalScore] represents the Practical group in the Group Editor window. This group displays practical scores for the student in each subject. - Static Cells: Static cells in the Row Groups and Column Groups are not represented in the Group Editor window because these cells are not associated with any grouped data. Static row and column cells are used to display labels and totals in a Tablix data region.
The static column cell displays the label ASSESSMENT and TOTAL ASSESSMENT in the Tablix data region. The static row cell displays the label Total in the Tablix data region.
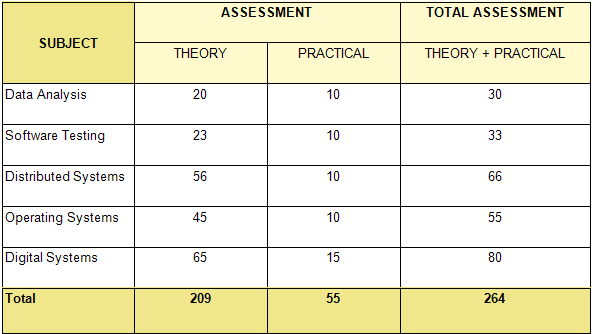
The image below displays the subjects in a row group. Nested column groups display practical and theory scores for the students. The total row displays the total scores for all of the subjects.
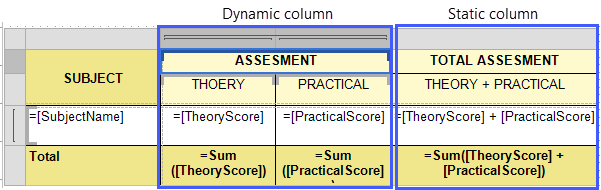
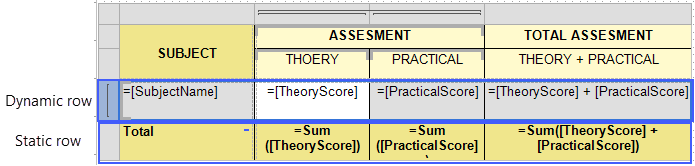
To perform basic operations in the Tablix data region, we need to first understand the concept of static and dynamic rows and columns.
Rows or columns in the Tablix data region can be static or dynamic. The Tablix data region contains multiple rows and columns that provide a grid type layout, where you can add or remove static or dynamic rows and columns in order to display your data efficiently.
- Static Rows and Columns - A static row or column is not associated with any group data. When the report runs, a static row or column is rendered only once. Labels and totals are displayed using static rows or columns in Tablix data region.
- Dynamic Rows and Columns - A dynamic row or column is associated with one or more groups, and renders once for every unique value in the group. You can also create dynamic group rows or columns by adding a row group or a column group.
Row and Column Handles
When you select a Tablix data region, the row and column handles appear. These handles help you to work with the data region and visually specify the type of data added in your tablix layout.
The following table shows the different types of handles that appear in a Tablix data region.
| Handle Icon | Description |
|---|---|
 |
Row or column with one outer group. |
 |
One outer group and one inner group. |
|
|
One outer group with an extra row for totals and one inner group. |

Tablix Layout Actions
The Tablix data region provides context menu options to perform basic layout actions. You can access layout options for Tablix rows from the context menu by right-clicking on a selected row.
-
Insert Row: Select from the following options to insert a row inside or outside of the selected group cell.
-
Inside Group: If a row group contains groups having distinct values, then as many rows are inserted as there are groups.
- Above: Inserts a row above for each unique value of the row group.
- Below: Inserts a row below for each unique value of the row group.
-
Outside Group: If a row group contains nested groups consisting of child and parent groups, then as many rows are inserted as there are parent groups.
- Above: Inserts a row above for each unique value of the parent row group.
- Below: Inserts a row below for each unique value of the parent row group.
-
Inside Group: If a row group contains groups having distinct values, then as many rows are inserted as there are groups.
- Delete Row: Delete the selected rows.
- Distribute Rows Evenly: Set the same height for multiple selected rows.
-
Add Row Group: Select from the following options to insert row groups in a tablix.
- Parent Group: To insert a parent row group.
- Child Group: To insert a child row group.
- Adjacent Above: To insert an adjacent row group above the selected row group.
- Adjacent Below: To insert an adjacent row group below the selected row group.
- Row Group: Select the Delete Group option to delete a row group.
You can access layout options for Tablix columns from the context menu by right-clicking on a selected column.
-
Insert Column: Select from the following options to insert a column inside or outside of the selected group cell.
-
Inside Group: If a column group contains groups having distinct values, then as many columns are inserted as there are groups.
- Left: Inserts a column to the left for each unique value of the column group.
- Right: Inserts a column to the right for each unique value of the column group.
-
Outside Group: If a column group contains nested groups consisting of child and parent groups, then as many columns are inserted as there are parent groups.
- Left: Inserts a column to the left for each unique value of the parent column group.
- Right: Inserts a column to the right for each unique value of the parent column group.
-
Inside Group: If a column group contains groups having distinct values, then as many columns are inserted as there are groups.
- Delete Column: Delete the selected columns.
- Distribute Columns Evenly: Set the same width for multiple selected columns.
-
Add Column Group: Select from the following options to insert column groups in a tablix.
- Parent Group: To insert a parent column group.
- Child Group: To insert a child column group.
- Adjacent Left: To insert an adjacent column group to the left of the selected column group.
- Adjacent Right: To insert an adjacent column group to the right of the selected column group.
- Column Group: Select the Delete Group option to delete a column group.
See Also