The Layer sample demonstrates how to work with Layers in four different reporting scenarios.
Sample Location
| Visual Basic.NET |
Copy Code
|
|---|---|
<User Folder>\GrapeCity Samples\ActiveReports 12\Page Reports And RDL Reports\API\Layer\VB.NET |
|
| C# |
Copy Code
|
|---|---|
<User Folder>\GrapeCity Samples\ActiveReports 12\Page Reports And RDL Reports\API\Layer\C# |
|
Run-Time Features
When you run this sample, the End User Designer shows a list of .rdlx reports on the bottom left of the form. Expand the Reports node to view reports under it and double-click a report to load it into the designer. Once the report is loaded in the designer, a Layers List window showing all the Layers used in the report is displayed as a tab next to the Report Explorer tab. See Working with Layers for further details on the Layers List window.
Project Details
ReportForm
This is the main form that appears when you run the Layers sample. This form uses controls such as Designer, ReportExplorer, LayerList, Toolbox, PropertyGrid, ToolStripPanel, ToolStripContentPanel and TreeView to create a customized report designer.
Right-click the form and select View Code to see how to set up the report designer. It also contains code that adds reports to the TreeView control, loads a report into the Designer when it is double-clicked in the Reports node, and shows the Layer List window if the report type is Page or RDL.
Reports Folder
AccountStatementSheet.rdlx: This report uses the XML data source connection to provide custom data. Controls such as Image, FormattedTextBox, Table and Label are used to display the statement of an account holder. The FormattedTextBox control contains text in HTML tags to display the content.
This report is contains three Layers besides the Default Layer with the following controls and TargetDevice settings.
| Layer Name | Target Device | Description |
|---|---|---|
| Default | All | This is a default layer. It does not contain any control. |
| Layer1 | Screen | Contains the Header and Footer section. |
| Layer2 | Screen, Paper | Contains a FormattedTextBox control to display the account information of the account holder. |
| Layer3 | All | Contains a Table data region and an OverflowPlaceHolder control to display the account transactions. |
SalesRevenueReport.rdlx: This report uses the Reels shared data source connection to provide the data. The layout of the report uses a Chart data region to graphically display sales and profit for each month and two Table data regions to display the chart data. The first Table data region (Layer2) contains the sales revenue for each month and the second Table data region (Layer3) lists down the detailed figures for the monthly sales along with a DataBar to visually depict the profits.
This report contains three Layers besides the Default Layer with the following controls and TargetDevice settings.
| Layer Name | Target Device | Description |
|---|---|---|
| Default | All | This is a default layer. It does not contain any control. |
| Layer1 | All | Contains a Chart data region to display the annual sales by month. |
| Layer2 | Paper | Contains a Table data region to display the sales by month. Visibility of this Layer has been set to hidden. |
| Layer3 | Screen, Export | Contains a Table data region to display the detailed sales and a DataBar to depict the profits. |
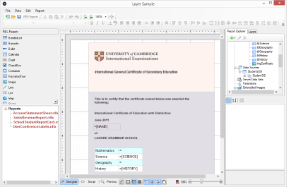
SchoolStudentReportCard.rdlx: This report uses the XML data source connection to provide custom data. This report includes an Image control that acts as a background layout of the report. It also includes a few TextBox controls to display the name and the grades obtained by the student.
This report contains two Layers besides the Default Layer with the following controls and TargetDevice settings.
| Layer Name | Target Device | Description |
|---|---|---|
| Default | All | This is a default layer. It does not contain any control. |
| Layer1 | Screen, Export | Contains an Image control with an image of a school graduation certificate. |
| Layer2 | All | Contains few TextBox controls to display the name and grades obtained by the student. |
UserConferenceLabels.rdlx: This report uses the Nwind shared data source connection to provide data. This report uses the Image, TextBox, BarCode and Label controls to create a layout for the User Conference 2014 ticket.
This report contains two Layers besides the Default Layer with the following controls and TargetDevice settings.
| Layer Name | Target Device | Description |
|---|---|---|
| default | All | This is a default layer. It does not contain any control. |
| Layer1 | Screen, Export | Contains Image controls to display the conference logo and sponsors and Label controls to display conference name and details. |
| Layer2 | All | Contains bound TextBox fields to display the conference attendee details and a BarCode control to display a unique BarCode for each attendee. |
See Also