The Reports Gallery sample demonstrates how to customize the End User Designer application by adding the TreeView control to display a list of categorized reports. At run time, the user can double-click any report out of the three categories: Page, Rdl and Section, and load it into the designer.
Sample Location
| Visual Basic.NET |
Copy Code
|
|---|---|
<User Folder>\Documents\GrapeCity Samples\ActiveReports 12\Reports Gallery\VB.NET |
|
| C# |
Copy Code
|
|---|---|
<User Folder>\Documents\GrapeCity Samples\ActiveReports 12\Reports Gallery\C# |
|
Run-Time Features
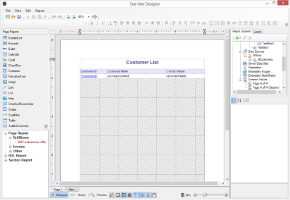
When you run this sample, the End User Designer appears with a list of report categories at the bottom left of the Form. Expand each category to view the reports under it and double-click any report to load it into the designer. You can also go to the Preview Tab to view the report.
Project Details
ReportsForm
This is the main form that appears when you run this sample. This form uses the ToolStripPanel, ToolStripContentPanel, Designer, Toolbox, ReportExplorer, TreeView, PropertyGrid and LayerList controls to create a customized unified ReportDesigner.
Right-click the Form and select View Code to see how to set up the designer and create a blank page report. It also contains code that attaches the Toolbox, ReportExplorer, PropertyGrid and LayerList controls to the Designer, inserts DropDown items to the ToolStripDropDownItem and sets their functions. Finally, it also contains code that adds the reports to the TreeView control, loads a report into the Designer when the report is double-clicked, and checks for any modifications that have been made to the report in the designer.
Reports folder
Reports folder consists of three subfolders - Page Report, RDL Report and Section Report, each containing a set of reports that highlight the major features of the corresponding report types.
Page Report folder
This folder contains several subfolders that illustrate the use of Page Reports in different scenarios.
DrillDown folder
AllCustomers report: This report uses the NWind shared data source. It uses the Table data region to display customer's contact details. The Textbox displaying the CustomerID field in the detail row of the Table is used to set a drill-through link to navigate to the CustomerDetails report.
Invoice folder
BillingInvoice report: This report uses the NWind shared data source. It showcases a billing invoice layout commonly used in convenience stores. The report mostly contains Label, TextBox and Line controls in its layout. It also includes an EAN128FNC1 barcode due to its high reading accuracy.
Invoice1 report: This report uses the NWind shared data source. It includes a BandedList and few TextBox controls to create the Invoice layout for displaying customer transactions. Both the page and the BandedList control are grouped by the OrderID field. One of the text boxes in the footer section of the BandedList control uses the Sum function to display the grand total of all transactions.
Invoice2 report: This report uses the NWind shared data source. It uses a Table, few TextBoxes and Shape controls to create the Invoice layout for displaying customer transactions. The report page is grouped by the CustomerID field, therefore all transactions made by a customer appear together based on the ID. One of the text boxes placed inside the Container control at the bottom of the report uses the Sum function to display the grand total of all transactions.
Invoice_Grouped report: This report uses the NWind shared data source. It uses the Table, few TextBox and Label controls to display customer transactions in an Invoice. The data is grouped on the CustomerID field, so that all transactions made by a customer appear together based on their ID.
Invoice_Parameters report: This report uses the NWind shared data source connection and two datasets to provide data. It is similar to the Invoice_Grouped report with an additional parameters feature. It uses parameters set on the CompanyName field to filter data on report preview.
Other folder
BarCode report: This report demonstrates all barcode types that are supported by ActiveReports. The barcode types are presented in the Table data region, using a single page layout. The rows of the table use alternate background colors (grey and white). At run time, the Barcode report displays one page that fits the table with all the sample barcodes.
Catalog report: This report uses the NWind shared data source. It shows a multi page layout spread over four pages in the report. The layout in Page1 and Page2 contains Image, Label and Textbox controls to display introductory text. The layout on Page3 contains a List data region with TextBox controls and a Table to display product details for each product category. The List is grouped by the CategoryID field to filter products by their category and its FixedSize property is set to fit in excess data. The layout on Page4 (that appears as page 9 at run time) uses Textbox, Shape and Line controls amongst others to create an Order Form, which a user is to fill manually.
CellMerging report: This report uses the NWind shared data source. This report demonstrates cell merging in Tablix data region, where cells with same values are merged automatically to avoid showing duplicate values. The row group area contains three groups that are nested in a parent/child relationship to display the row group data. The Country (parent) and City group (child) values are merged automatically to remove duplicate data values.
DeliverySlip_theme report: This report uses the Seikyu2 shared data source. It uses the TextBox, Label, Container controls and two Table data regions to display the invoice information. The report uses two themes and has its CollateBy property set to ValueIndex to determine the order in which the report pages are rendered. Some TextBox controls on the report also use the Sum function to display the total price information for each Invoice. The page is grouped on the EstimateID field, so the invoices are sorted by EstimateID.
EmployeeSales report: This report uses the NWind shared data source. It contains the Chart and Table data regions to display sales by each employee for the year 1997. A column chart shows the graphical representation of sales by each employee while the Table lists down the exact sales figures. One of the TextBox controls on the report also uses the Sum function to display the grand total of all sales.
IRS-W4 report: This report uses the IRS XML data source to provide data to the report. It mainly contains Textbox, CheckBox, Shape and Line controls to create the layout of a tax form used in the US.
Letter report: This report uses the NWind shared data source. It contains an Image, FormattedTextBox, Table and an OverflowPlaceholder controls to create a layout for a letter. The FormattedTextBox control uses text with HTML tags to display content. The Table displays OrderID with order dates and order amount and is linked with the OverflowPlaceholder control to display excess data on the same page. The Reels logo, displayed on the report inside the Image control, is embedded within the Reels theme and the TextBox placed below the Image control uses a Global expression to display the current date. The layout page is grouped by the CustomerID field to filter data on each report page according to individual customers.
MyOrdersReport report: This report uses MyOrders.csv as a data source to demonstrate the native support for CSV data providers. It contains a Table data region that displays orders with data fetched from the CSV data source.
PurchaseReport report: This report uses the NWind shared data source. It contains the Textbox and Table controls to display purchase details for each company. The layout page is grouped by the Company_CD field to filter data on each report page according to the company. The Textbox control placed below each table column uses the Sum function to display totals. The FixedSize property of the Table is set to fit in excess data.
ReelsTablix report: This report uses the Reels shared data source. It contains the Tablix data region to display a sales report for each country, city and media type by year. The Tablix data region uses row grouping to group the data by Country, City and MediaType, and column grouping to group the data by Years and Quarters.
ResourceConsumptionByYear report: This report uses MostPopulatedCountriesEnergyUsageByYear shared data source. It illustrates composite charts by using a Chart data region that shows annual Natural Resource Consumption - Oil and Electricity - versus Population size. Natural Resource Consumption and Population size are plotted on the two Y axes represented by two different chart types - Column and Line. The report also contains a parameter which lets users choose the country for which they want to view the data.
SalesReport report: This report uses the Reels data source connection and two datasets that fetch data through a Stored Procedure. The layout of the report uses the Chart to display sales and profit for the selected date range and the Table to display the numeric values of the same. The table also uses the DataBar function to plot profits graphically. The Reels logo, displayed on the report inside the Image control, is embedded within the Reels theme. This report also uses two nullable parameters to select the range of dates.
Tablix Sample report: This report uses the NWind shared data source. It contains the Tablix data region that displays an orders report with product category and names showing quarterly and yearly orders. The Tablix uses a nested row grouping to group the Tablix data region by CategoryName and ProductName, and nested column grouping to group the Tablix data region by Years and Quarter. The tablix body area displays the aggregate Sum for each category and the grand total of order amount.
TackSeal report: This report uses the NWind shared data source. It contains the OverflowPlaceholder control and the List data region to create a columnar display of tack seals with postal barcodes. The List data region has its OverflowName property set to OverflowPlaceHolder1 and the OverflowPlaceHolder1 control has its OverflowName property set to OverflowPlaceHolder2 to assure correct display of columnar data display within the report page.
RDL Report folder
This folder contains several subfolders that illustrate the use of RDL Reports in different scenarios.
Calendar folder
Events report: This report uses XML data containing event details entered directly in the connection string of the data source and accessed by the dataset. It contains a Calendar control to display events.
EventTypes report: This report uses XML data containing event details entered directly in the connection string of the data source and accessed by the dataset. It contains a Calendar control to display Family, Music and Cultural events. A custom event background color is also set for each event type in the Script tab.
Vacations report: This report uses XML data containing event details entered directly in the connection string of the data source and accessed by the dataset. It contains a Calendar control to display employee's vacations.
DashBoard folder
CallCenterDashBoard report: This report uses the CallCenter shared data source. It contains uses the Bullet control to indicate when the data is approaching or past a warning range and the Sparkline controls to indicate daily trends in key pieces of performance and sales data. It also uses the Icon Set data visualizer to indicate the warning levels for key performance data.
MarketDashBoard report: This report uses the MarketData shared data source. It contains the Sparkline control to display stock price trends over the last 30 days. The Sparkline allows investors to see trends without knowing what actual values are associated with each point.
TeamList report: This report uses the FootballStatistics shared data source. It contains the List control that displays a list of team names with drill-through links to navigate to the TeamStatisticsDashboard.rdlx report that displays the selected team's statistics.
SalesDashboard report: This report uses the SalesResult shared data source. It consists of two datasets to display multiple Chart controls and a Tablix data region to visualize the sales performance data. This report illustrates the Galley-mode feature where all of the report contents can be previewed in a single scrollable page.
FactBook folder
CountryFacts report: This report uses the Factbook shared data source. It contains a List data region grouped on CountryID that groups data by Country. The report also contains a map image whose Value property is set to the expression with the MapCode data field from the XML data source. It contains a hidden parameter that is used to accept the Country ID. This report is called in other reports by drill-through links or as a subreport, so the Country ID is passed silently. The default ID is the World. The dataset has a filter that retrieves only countries, specified by the report parameter. From each textbox with category under Energy Production / Consumption you can see the Image control that uses the Icon Set data visualizer to flag energy categories where consumption is greater than production.
LifeExpectancyByGdpAndMedianAge report: This report uses the Factbook shared data source. It contains the Tablix data region to compare the average life expectancy based on the category where the Median age and GDP fall. The tablix data region consist of a row group GDP of country and a column group Median Age to display the data.
Top10CountriesByGdp report: This report uses the FactbookSortedByGdp shared data source and shows the Top 10 countries by GDP. It contains a List data region with an image in the Image control that uses the RangeBar function to create an ad-hoc horizontal bar chart.
Reels folder
CustomerMailingList report: This report uses the Reels shared data source. It includes a Container control along with TextBox and Barcode controls to display a mailing list of customers. The Columns property of the Body section is set to 3 to display mailing labels in three columns.
CustomerOrders report: This report uses the Reels shared data source. It contains the List and Table data regions that group data by CustomerID and SaleID respectively to display order information. The SalesAmount textbox of the Table has its Value property set to Sum function to calculate the total for each order (as a table group subtotal). The YearTotal textbox of the Table also has its Value property set to Sum function to calculate the total of pre-tax sales. The Reels logo that is displayed on the report is embedded within the Reels theme. The page number in the PageHeader section is reset every time a new customer is displayed. This report also contains a subreport, CustomerOrdersCoupon.rdlx.
DistrictReport report: This report uses the Reels shared data source. It contains the Chart and Tablix data region to display the number of sold items and the profit for each month during the two year span (2004-2005) for the selected district. The Tablix data region consists of a row group SaleDate and a column group StoreName. The report parameter determines which district to display and uses the available values from the second report dataset SalesData.The StoreName textbox in the report body uses the drill-through link (the Action is set to Jump to report) that opens the StoreReport.rdlx with more information.
DistrictSales report: This report uses the Reels shared data source. It contains the BandedList data region that groups data by SaleYear, DistrictID and RegionID to display district sales details. Sum function is used to get the total sales at the District, Region, Year levels and also to display a grand total. The Reels logo that is displayed on the report is embedded within the Reels theme.
Filmography report: This report uses the Reels shared data source. It contains nested List data regions that group data by MovieID and MoviePersonID to return a distinct number of movies with the selected actors. The report contains two cascading parameters that narrow down the number of actors displayed in the list first based on the alphabet with which the actor's name begins and then based on the actor's name. The Reels logo that is displayed on the report is embedded within the Reels theme.
GenreSales report: This report uses the Reels shared data source. It contains a Tablix data region to display the units sold for each genre, in each year and each quarter. The Tablix report data consist of a row group GenreName and a column group SaleDate.Year to display the data. The report also uses the plain column Chart to display the number of titles sold for each genre. This report uses the multi value parameter that allows you to select more than one genre for displaying sales data.
GenreStatistics report: This report uses the Reels shared data source. Median and Mode aggregate functions are used to show the middle values in a set of data as well as the most commonly occurring value. It also uses the ReelsConfidential.rdlx-master report to provide standard page headers and footers. The Reels logo that is displayed on the report is embedded within the Reels theme.
MonthlySalesReport report: This report uses the Reels shared data source. It contains a Table data region that groups data by DistrictID. The Textbox controls in the Table have their Value property set to expressions to display the total of sales for each district and region as well as the totals of all districts within a region for a given month. It also uses the Plain Line Chart with the data grouped and sorted by Day for each SaleDate to display sales and profit for the selected month. This report uses query based parameters to select the month and region for displaying data. The Reels logo that is displayed on the report is embedded within the Reels theme.
MovieCatalog report: This report uses the Reels shared data source. It contains the Image, TextBox, TableofContents and List controls to display the list of movies in a catalog. This report uses the TableofContents control to display, an organized hierarchy of the report heading levels and labels along with their page numbers, in the body of a report. It also uses the TextBox and Image control to display the layout of the report. The Reels logo that is displayed on the report is embedded within the Reels theme.
MovieReport report: This report uses the Reels shared data source. It contains four List data regions with groupings. The MovieList is grouped by MovieID, the GenreList is used to display the genre names and is grouped by GenreID, the CrewList is used to display the title and is grouped by CrewTitleID, and finally the CastNameList is used to display the cast and crew and is grouped by MoviePersonID. This report uses cascading parameters. The first parameter asks to select which letter the movie titles starts with, and then the second parameter asks to select a movie to display. The CrewName textbox in the report Body uses the drill-through link (the Action is set to Jump to report) that opens Filmography.rdlx with more information on the selected person. The parameters of this report are passed to the Filmography.rdlx report. The Reels logo that is displayed on the report is embedded within the Reels theme.
RegionPerformance report: This report uses NWind.mdb database. It contains the Table data region that uses the Region value to group the report data and the SalesAmount value to sort the report data. It also uses filtering to filter the report data by the RegionID value. Textbox controls in the Table have their Value properties set to Sum functions to display the total of sales amount for each region. The Reels logo that is displayed on the report is embedded within the Reels theme.
ReorderList report: This report uses Reels shared data source. It contains the Table data region without any grouping. The Table detail row has its BackgroundColor property set to the expression to create a light yellow bar report. The Reels logo that appears on the report is embedded within the Reels theme.
SalesByMediaType report: This report uses the Reels shared data source. It contains the List data region that is grouped by Image to display data. The list also includes the Table data region that groups its data by MediaID. The report also contains the Plain Column Chart to display sales and profit by media type and embedded images for each category. This report uses the ReelsConfidential.rdlx-master report to render the report page header and footer.
SalesByRegion report: This report uses the Reels shared data source. It contains the Tablix data region and subtotals to display the number of units sold and profit for each region by year and quarter. The Tablix report data consist of a row group Region and a column group SaleDate.Year to display the data. The report also uses the Plain Column Chart to display the annual profit for each region. Data in the Chart is also grouped by Region and SaleDate.Year.
SalesReceipt report: This report uses the Reels shared data source. It contains a Table data region and three Container controls nested in the List data region. The List is grouped by SaleID to produce the body of the receipt. The salesTaxLabel and totalSalesTax text boxes use the Sum function that totals the amount due in the list and adds tax to the sum of a field for the grand total due. The Reels logo that is displayed on the report is embedded within the Reels theme.
SalesReport: This report uses the Reels shared data source. It contains a Table and Chart data regions to display totals of sales and profit for the selected date range. The Table also uses the Data Bar function to plot the profits. The Chart and Table data is grouped by Month and Year. The Month textbox uses the drill-through link to display MonthlySalesReport.rdlx with more information on the selected month. This report uses parameters that allow the null value to select the range of dates. The Reels logo that is displayed on the report is embedded within the Reels theme.
StorePerformance: This report uses the Reels shared data source. It identifies stores with profits above or below expectations. It also has two Image controls that display the database images and use the IconSet function. This report uses the ReelsConfidential.rdlx-master report to render page headers and footers.
StoreReport report: This report uses the Reels shared data source. It contains the Table, List and Chart data regions to display sales for each employee. The Table and Chart data is grouped by EmployeeID. The Table uses hierarchical grouping to show the relationship between employee and supervisor for each store. The FirstName textbox has its Padding> Left property set to the Level function that leaves a space 15 pixels wide to the left of the control. This is the drill-down report where the Visibility > Hidden property of the Table detail row is set to =Fields!Supervisor.Value <> 0 and the Visibility > ToggleItem property is set to the FirstName data field. The expression in the Visibility > Hidden property calculates whether the supervisor field returns 0, so only the supervisor's name is displayed initially. By clicking the toggle image next to the supervisor's name, the rows with details about employees are displayed. The report uses a cascade of parameter values - Region, District and StoreNumber. Each parameter depends on the value of the previous parameter and each comes from a separate dataset. The Reels logo that is displayed on the report is embedded within the Reels theme.
TopPerformers report: This report uses the Reels shared data source. It contains two Table data regions to display the top and bottom performers based on the movies sales. Each Table data is grouped by MoviePersonID and MovieID (nested grouping). The TopN filter is applied to one table and the BottomN filter is applied to another. The number of items returned by each of the filters is specified in report parameters. This report also uses two integer parameters to alter the number of items displayed in each table. The parameters use default values, which are passed to textboxes of the Table Headers. This is the drill-down report where the second Table Group Header in each Table has its Visibility > Hidden property set to True and the ToggleItem property set to the PerformerName textbox. By clicking the toggle image next to the name, the rows containing details about performers are displayed.
Others folder
AnnualPortfolioChart report: This report uses the MostPopulatedCountriesEnergyUsageByYear shared data source. It illustrates composite charts by using a Chart data region that shows Annual Stock Performance. The Trading Volume and Trading Value are plotted on two Y axes represented by two different chart types, Column and Line.
Flight On-time Performance Report: This report shows on-time performance of US airlines. The report uses nested data regions bound to different datasets from the following data sources:
- States.xml - XML file stores information about geographical data of regions and states US.
- FlightDetails.csv - CSV file stores flight information - flight date, arrival time, departure time, etc.
- Airlines.json - JSON file stores unique airlines names corresponding to an airlineID.
The controls that are included in this report are List, Container, Table, and Tablix, where Container, Table, and Tablix are nested inside List. These controls show data as described below:
- List displays geographical information - Region, State Name, and Number of Airports, from States.xml data file through Tablix data region and Textbox control inside Container control.
- Table displays flight information - Number of flights, on-time arrival and departure details, from FlightDetails.csv.
The mapping for 'DataSet Joins' is created by adding a filter in Table on Region fields. This lists the flight information in Table control that flew in a particular region displayed in the List.
Section Report folder
BarCode report: This report displays all barcode types that are supported by ActiveReports.
- PageHeader section: This section contains the table columns to display the report header. The Text property of the two Textbox controls, define the name of the two table columns.
- Detail section: This section contains a list of all the Barcode types that are supported by ActiveReports. The barcodes are presented in a table that contains two columns, the one with the Textbox control displays the barcode name, and the other one with the Barcode control displays the barcode image.
Invoice1 report: This report calculates the total amount for each customer along with purchase details. The report also displays the average of the previous invoice amount, the current invoice amount and the consumption tax. This report uses Bill.mdb database to provide data.
- PageHeader section: This section contains the Label and Textbox controls. It uses the bound data fields to calculate the invoice information in the header. The values of the Excise and BillTotal Textbox controls are set in the Script tab and are calculated in the BeforePrint event.
Note: This sample uses bound fields on the PageHeader section, assuming that the value of all records to be displayed on a page does not change.
However, it is not recommend that you place bound fields in the PageHeader or PageFooter sections because these sections are displayed on a page once. For the same reason it is not recommended that you place bound fields on the GroupHeader and GroupFooter sections.
- GroupHeader section: This section (ghColumnCaption) contains the Label controls that are captions for the information displayed in the Detail section. This section also uses the CrossSectionBox and the Shape controls.
- Detail section: This section contains the bound TextBox controls that display each row of data associated with the current ghColumnCaption. The Shape control is used to alternate row colors in the Detail section. Go to the Script tab and see the shpDetailBack.BackColor property in the Detail_Format event.
- PageFooter: This section contains the Label controls that explain codes used in the Category column of the invoice details.
Invoice2 report: This report shows another invoice layout and uses Seikyu2.mdb database to provide data.
- GroupHeader1 section: This section contains the Label and Textbox controls. It uses the bound data fields to calculate the invoice information in the header. The values of the Year, Month and Day Textbox controls are set under the Script tab and are calculated in the ReportStart event. It also uses the CrossSectionLine and the CrossSectionBox controls that span the GroupHeader1 section to Detail section. The CrossSection Box ends in the GroupFooter1 section. These controls form vertical lines between columns of the invoice details and a rectangle around the details of the invoice at run time.
- Detail section: This section uses the data table tb_Main for the main report data and the data table tb_Count to retrieve the number of data items within a group. The Detail data in each group is retrieved beforehand to calculate the required number of empty rows. For the required empty row count, substitute data with "" in the FetchData event. The Shape control is used to alternate row colors in the Detail section. Go to the Script tab and see the shpDetailBack.BackColor property in the Detail_Format event.
- GroupFooter1 section: This section contains the Label and Textbox controls that display the totals of the invoice. The values of the Tax and Pretax Textbox controls are set under the Script tab and are calculated in the Format event.
LabelReport report: This report displays the tack seal, which is commonly used in postal services. This multi-column report uses the customer barcode that is bound to data by using the DataField property. This report uses Nwind.mdb database to provide data.
- Detail1 section: This section contains the bound data fields to display the contact information and the Barcode control that is bound to data by using the DataField property. The ColumnCount property is set to 3, which allows the report to display the tack seal in 3 columns.
PaymentSlip Report: The report displays the salary payment slip where the EAN128FNC1 barcode is used for barcode bound to a data field. This report uses Bill.mdb data source connection to provide data.
- Detail section: This section contains bound data fields to display the payment information and the Barcode control that is bound to data by using the DataField property.
PurchaseOrder report: The report displays purchase slips created with bound data. It groups data for each purchase slip. The detail count is not fixed but the number of rows in the report layout is fixed. In this case, when the RepeatToFill property of the Detail section is set to True, the detail data is repeatedly displayed on the entire page. The report uses the RepeatToFill property and calculated fields to demonstrate how to create the report layout without any code. Calculated fields are used to calculate the total cost and the total selling price. This report uses Shiire.mdb data source.
- groupHeader1 section: This section contains the Label and Textbox controls. It uses the bound data fields to calculate the company information in the header.
- Detail section: This section contains Textbox controls. It uses bound data fields to calculate the product information in the body of the report. The detail.BackColor property is used to alternate row colors in the Detail section. Go to the Script tab and see the detailBack.BackColor property in the detail_Format event.
- groupFooter1 section: This section contains the Label and Textbox controls. It uses the bound data fields to calculate the total information in the footer of the report group.
Schedule report: The sample report displays the weekly schedule of employees in the gantt chart format. The report displays six day report schedules on a single page in the Viewer control. This report uses Schedule.mdb database to provide data.
- GroupHeader1 section: This section contains the Label and Textbox controls. It uses the bound data fields to calculate the employee information in the header.
- Detail section: The Gantt chart view is created by using the Label, Shape and Line control. You can display the horizontal bars like in the gantt chart by modifying the size of the Label control. To add horizontal bars, you can dynamically add twenty four (12 x 2) Label controls within the 9-20 hours time frame that will become the horizontal bars of gantt chart in the ReportStart event. Once they are added, set the Visible property to False to hide them.
You can adjust the width of horizontal bars by setting calculated values from the time width in the Tag property of the Label control within Detail_Format event. For the horizontal adjustment of bars, change the width of the Label control to match with the value in the Tag property.
UnderlayNext report: This report displays the bound data. It uses Nwind.mdb database to provide data.
- PageHeader section: This section contains the Label and Line controls to create the header for report data.
- GroupHeader1 section: This section contains a TextBox control bound to the Country field and the CrossSectionLine controls to create the table for the body data of the report. UnderlayNext Property of this section is set to True to align the beginning position of the report data in the Detail section with the GroupHeader1 section.
- Detail section: This section contains the bound Textbox controls to display report data. This section displays the name of the city, contact name and postal code for each customer according to their countries.
See Also