The Chart control supports the creation of additional custom axes through the use of the chart's CustomAxes collection. Once a custom axis has been added to the collection, in addition to setting the normal axis properties, you will need to set the following properties:
- Parent - The Parent property allows you to choose the primary or secondary axis on which your custom axis resides.
- PlacementLength - The PlacementLength property allows you to set the length of the custom axis in proportion to the Min and Max property values you have already set for the parent axis.
- PlacementLocation - The PlacementLocation property allows you to set the starting location value for the custom axis to appear in relation to the parent axis.
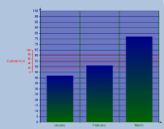
The following code sample demonstrates creating a custom axis, adding it to the Axes collection for the ChartArea, and setting its properties.
To write code in Visual Basic.NET
| Visual Basic code. Paste INSIDE the section Format event |
Copy Code
|
|---|---|
' create the custom axis and add it to the ChartArea's Axes collection
Dim customAxisY As New GrapeCity.ActiveReports.Chart.CustomAxis
Me.ChartControl1.ChartAreas(0).Axes.Add(customAxisY)
' set the basic axis properties for customAxisY
customAxisY.LabelFont = New GrapeCity.ActiveReports.Chart.FontInfo(Color.Red, New Font("Arial", 7.0!))
customAxisY.LabelsGap = 1
customAxisY.LabelsVisible = True
customAxisY.Line = New GrapeCity.ActiveReports.Chart.Graphics.Line(Color.Red, 1, GrapeCity.ActiveReports.Chart.Graphics.LineStyle.Solid)
customAxisY.Max = 100
customAxisY.Min = 0
customAxisY.MaxDerived = False
customAxisY.Visible = True
' set major tick
customAxisY.MajorTick = New GrapeCity.ActiveReports.Chart.Tick(New GrapeCity.ActiveReports.Chart.Graphics.Line(Color.Red, 1), New GrapeCity.ActiveReports.Chart.Graphics.Line(Color.Red, 1), 20, 5, True)
|
|
To write code in C#
| C# code. Paste INSIDE the section Format event |
Copy Code
|
|---|---|
// create the custom axis and add it to the ChartArea's Axes collection
GrapeCity.ActiveReports.Chart.CustomAxis customAxisY = new GrapeCity.ActiveReports.Chart.CustomAxis();
this.ChartControl1.ChartAreas[0].Axes.Add(customAxisY);

// set the basic axis properties for customAxisY
customAxisY.LabelFont = new GrapeCity.ActiveReports.Chart.FontInfo(Color.Red, new Font("Arial", 7F, FontStyle.Regular, GraphicsUnit.Point, ((System.Byte)(0))));
customAxisY.LabelsGap = 1;
customAxisY.LabelsVisible = true;
customAxisY.Line = new GrapeCity.ActiveReports.Chart.Graphics.Line(Color.Red);
customAxisY.MajorTick = new GrapeCity.ActiveReports.Chart.Tick(new GrapeCity.ActiveReports.Chart.Graphics.Line(Color.Red, 1), new GrapeCity.ActiveReports.Chart.Graphics.Line(Color.Red, 1), 1, 2F, true);
customAxisY.MajorTick.GridLine = new GrapeCity.ActiveReports.Chart.Graphics.Line(Color.Red, 1, GrapeCity.ActiveReports.Chart.Graphics.LineStyle.Solid);
customAxisY.MajorTick.Visible = true;
customAxisY.Max = 5;
customAxisY.MaxDerived = false;
customAxisY.Min = 0;
customAxisY.Visible = true;

// set the special custom axis properties
customAxisY.Parent = (GrapeCity.ActiveReports.Chart.Axis)this.ChartControl1.ChartAreas[0].Axes["AxisY"];
customAxisY.PlacementLength = 20;
customAxisY.PlacementLocation = 30;
|
|
See Also