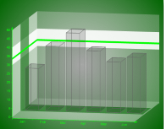
The Chart control supports constant lines and stripes through the use of the WallRanges collection. It allows you to display horizontal or vertical lines or stripes in a chart to highlight certain areas. For example, you could draw a stripe in a chart to draw attention to a high level in the data or draw a line to show the average value of the data presented.
Note: The Chart control does not aggregate average values. Please aggregate the average values beforehand and then render the line.
Important properties
- StartValue Sets the start value on the primary axis for the wall range.
- EndValue Sets the end value on the primary axis for the wall range.
- PrimaryAxis Sets the axis on which the wall range appears.
The following code demonstrates how to create wall ranges, set their properties, and assign them to a chart area at run time. The results are shown in the image above.
To write code in Visual Basic.NET
| Visual Basic code. Paste INSIDE the section Format event |
Copy Code
|
|---|---|
' Create the WallRange objects
Dim wallRange1 As New GrapeCity.ActiveReports.Chart.WallRange
Dim wallRange2 As New GrapeCity.ActiveReports.Chart.WallRange
Dim wallRange3 As New GrapeCity.ActiveReports.Chart.WallRange

' Set WallRange property
With wallRange1
    .Backdrop = New GrapeCity.ActiveReports.Chart.Graphics.Backdrop(Color.White)
    .Border = New GrapeCity.ActiveReports.Chart.Border(New GrapeCity.ActiveReports.Chart.Graphics.Line(Color.Transparent, 0, GrapeCity.ActiveReports.Chart.Graphics.LineStyle.None), 0, Color.Black)
    .EndValue = 40
    .PrimaryAxis = ((CType(Me.ChartControl1.ChartAreas(0).Axes("AxisY"), GrapeCity.ActiveReports.Chart.Axis)))
    .StartValue = 30
End With
With wallRange2
    .Backdrop = New GrapeCity.ActiveReports.Chart.Graphics.Backdrop(Color.Lime)
    .Border = New GrapeCity.ActiveReports.Chart.Border(New GrapeCity.ActiveReports.Chart.Graphics.Line(Color.Transparent, 0, GrapeCity.ActiveReports.Chart.Graphics.LineStyle.None), 0, Color.Black)
    .EndValue = 34
    .PrimaryAxis = ((CType(Me.ChartControl1.ChartAreas(0).Axes("AxisY"), GrapeCity.ActiveReports.Chart.Axis)))
    .StartValue = 33
End With
With wallRange3
    .Backdrop = New GrapeCity.ActiveReports.Chart.Graphics.Backdrop(Color.DarkGreen, CType(150, Byte))
    .Border = New GrapeCity.ActiveReports.Chart.Border(New GrapeCity.ActiveReports.Chart.Graphics.Line(Color.Transparent, 0, GrapeCity.ActiveReports.Chart.Graphics.LineStyle.None), 0, Color.Black)
    .EndValue = 40
    .PrimaryAxis = ((CType(Me.ChartControl1.ChartAreas(0).Axes("AxisZ"), GrapeCity.ActiveReports.Chart.Axis)))
    .StartValue = 20
End With

' Add the WallRange to the chart area and set wall and Z axis properties to show lines.
With ChartControl1.ChartAreas(0)
    .WallRanges.AddRange(New GrapeCity.ActiveReports.Chart.WallRange() {wallRange1, wallRange2, wallRange3})
    .WallXY.Backdrop.Alpha = 100
    .WallXZ.Backdrop.Alpha = 100
    .WallYZ.Backdrop.Alpha = 100
    .Axes(4).MajorTick.Step = 20
    .Axes(4).Max = 60
    .Axes(4).Min = 0
    .Axes(4).Visible = True
End With
|
|
To write code in C#
| C# code. Paste INSIDE the section Format event |
Copy Code
|
|---|---|
// Create the WallRange objects
GrapeCity.ActiveReports.Chart.WallRange wallRange1 = new GrapeCity.ActiveReports.Chart.WallRange();
GrapeCity.ActiveReports.Chart.WallRange wallRange2 = new GrapeCity.ActiveReports.Chart.WallRange();
GrapeCity.ActiveReports.Chart.WallRange wallRange3 = new GrapeCity.ActiveReports.Chart.WallRange();

// Set WallRange property
wallRange1.Backdrop = new GrapeCity.ActiveReports.Chart.Graphics.Backdrop(System.Drawing.Color.White);
wallRange1.Border = new GrapeCity.ActiveReports.Chart.Border(new GrapeCity.ActiveReports.Chart.Graphics.Line
(System.Drawing.Color.Transparent, 0, GrapeCity.ActiveReports.Chart.Graphics.LineStyle.None),
0, System.Drawing.Color.Black);
wallRange1.EndValue = 40;
wallRange1.PrimaryAxis = (GrapeCity.ActiveReports.Chart.Axis)this.ChartControl1.ChartAreas[0].Axes["AxisY"];
wallRange1.StartValue = 30;
wallRange2.Backdrop = new GrapeCity.ActiveReports.Chart.Graphics.Backdrop(System.Drawing.Color.Lime);
wallRange2.Border = new GrapeCity.ActiveReports.Chart.Border(new GrapeCity.ActiveReports.Chart.Graphics.Line
(System.Drawing.Color.Transparent, 0, GrapeCity.ActiveReports.Chart.Graphics.LineStyle.None),
0, System.Drawing.Color.Black);
wallRange2.EndValue = 34;
wallRange2.PrimaryAxis = (GrapeCity.ActiveReports.Chart.Axis)this.ChartControl1.ChartAreas[0].Axes["AxisY"];
wallRange2.StartValue = 33;
wallRange3.Backdrop = new GrapeCity.ActiveReports.Chart.Graphics.Backdrop(System.Drawing.Color.DarkGreen);
wallRange3.Border = new GrapeCity.ActiveReports.Chart.Border(new GrapeCity.ActiveReports.Chart.Graphics.Line
(System.Drawing.Color.Transparent, 0, GrapeCity.ActiveReports.Chart.Graphics.LineStyle.None),
0, System.Drawing.Color.Black);
wallRange3.EndValue = 40;
wallRange3.PrimaryAxis = (GrapeCity.ActiveReports.Chart.Axis)this.ChartControl1.ChartAreas[0].Axes["AxisZ"];
wallRange3.StartValue = 20;

// Add the WallRange to the chart area and set wall and Z axis properties to show lines.
this.ChartControl1.ChartAreas[0].WallRanges.AddRange(
new GrapeCity.ActiveReports.Chart.WallRange[] {wallRange1,wallRange2,wallRange3});
this.ChartControl1.ChartAreas[0].WallXY.Backdrop.Alpha = 100;
this.ChartControl1.ChartAreas[0].WallXZ.Backdrop.Alpha = 100;
this.ChartControl1.ChartAreas[0].WallYZ.Backdrop.Alpha = 100;
this.ChartControl1.ChartAreas[0].Axes[4].MajorTick.Step = 20;
this.ChartControl1.ChartAreas[0].Axes[4].Max = 60;
this.ChartControl1.ChartAreas[0].Axes[4].Min = 0;
this.ChartControl1.ChartAreas[0].Axes[4].Visible = true;
|
|
See Also