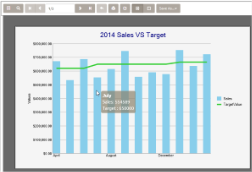
Tooltips display information about the area hovered by a cursor. When viewing a Chart, tooltips display information about data points and labels when you hover the cursor over a data series.
You can define tooltips for the chart's data point (viewed in HTML5 Viewer) by using expressions in the Tooltip field of the Series Values of the Chart Data dialog. You can also set a tooltip for a Chart in code by using the ToolTip property.
If the Tooltip property is set, the label value of the current category group is displayed with the data points. In case of a nested grouping, the lowest category group value is displayed.
The following chart types, which do not support any interactivity feature, also do not support tooltips for charts in the HTML5 Viewer.
- Area 3D - Stacked and Percent Stacked
- Financial and Financial 3D – Kagi
- Scatter and Scatter 3D - Connected and Smoothly Connected
Note: This topic uses the HTML5Viewer sample located in [User Documents folder]\GrapeCity Samples\ActiveReports 12 folder.
To add tooltips to a Chart viewed on HTML5 Viewer
- Open the HTML5Viewer sample.
- In the Solution Explorer, go to the Reports folder and open SalesDashboard.rdlx.
- In the Report Explorer, select the chSales_Column chart.
- In the Properties window, click Chart data to open the Chart Data dialog.
- Go to the Series Values page and select Sales.
- In the Tooltip field, enter the following expression:
="Sales: " & Sum(Fields!Sales.Value)
- On the Series Values page, select TargetValue.
- In the Tooltip field, enter the following expression:
="Target : " & Fields!TargetValue.Value
- Click OK and run the application. The tooltips are displayed on hovering the Chart series.
Note:
- Tooltips are visible only at run time if the Tooltip property is not null.
- The bold text in the tooltip is the Label value of the current category group. You can view the expression used for a tooltip in the Label field located on the Category Groups page of the Chart Data dialog.
- If you have not specified the Label of the category group, then the label value in the tooltip will be auto-generated.
See Also