A master detail report can be created by grouping the details in the Details row of Table data region. For each associated row from the master record, the grouped details are repeated.
Consider that you want to create a report that shows titles and corresponding values of quantity, price, and total price. You also want these details to be categorized according to the customer name. In this case, the details go to the details row of the table, and these details are repeated for each customer.
What You Will Learn
This tutorial guides you through the steps to create a master detail report by grouping a part of data in a Table data region.
- Access the ActiveReports Web Designer and Add Data Set
- Create Report Layout
- Bind Data to Table Data Region
- Preview Report
- Add Groups and Bind Data to Groups in the Table Data Region
- Add Report Title
- Customize the Appearance of Report
- Preview and Save Report
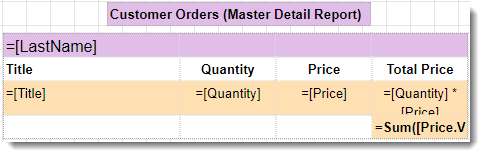
After you complete this tutorial, you will have a report that looks similar to the following.

Access the ActiveReports Web Designer and Add Data Set
- On the ActiveReports Server Report Portal, click Create report.
The ActiveReports Web Designer opens in the new browser tab. - From the top right corner of Web Designer, click the Data icon
 .
. - Click Add and then from the shared data sets available, select CustomerOrders.
- Click Add. The CustomerOrders data set is added to the report.
Report without Grouping
Create Report Layout
- Drag and drop Table data region
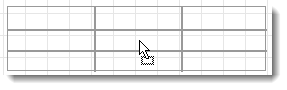
 onto the design area of the report. By default, you have a table with three rows and three columns.
- To add one more column to the table, click inside the table to display the column handle, and then click the plus sign.
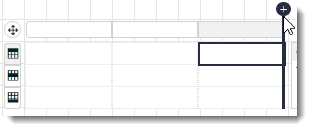
Now we have a table with three rows and four columns.
Bind Data to Table Data Region
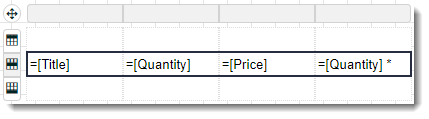
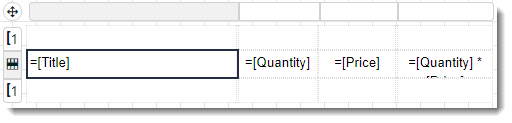
Let us now populate the Table data region with data. The detail part of the report will consist of titles and corresponding values of quantity, price, and total price.
-
To fill the data in details row of the table,
- Click the dropdown next to the CustomerOrders data set to view fields.
- Drag and drop the Title field on the first column, Quantity field on the second column, and Price on the third column.
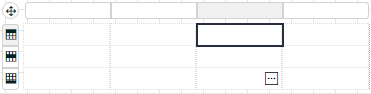
- To add total field in the fourth column of the details row, select the last text box in the details row.
- Go to the Properties pane, and select the radio button next to Value property.
- Select Expressions... from the drop down and enter the following expression in the Expression Editor:
=Fields!Quantity.Value * Fields!Price.Value.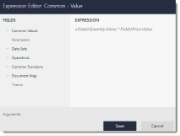
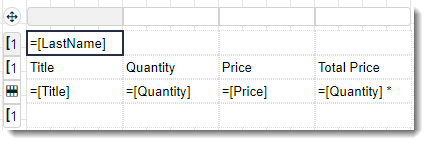
The table should now look like the following image.
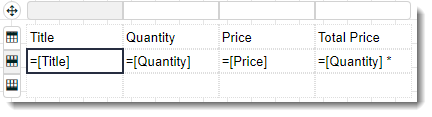
- In the header row above the details row, enter the labels for the details as shown.
Preview Report
- Click Preview
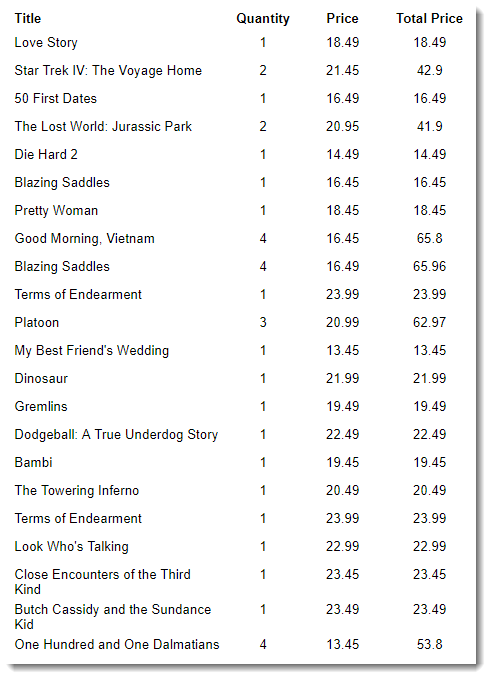
 to view your report in the final output. This is a simple tabular report with details and label for each column. The labels for the details are displayed on the first page of the report.
 - Exit the preview mode by clicking Back on the top left side of the designer.
Report with Grouping (Master - Detail Report)
Let us add more meaning to the report by adding groups.
We will group the details according to the customer names, and will have the column labels repeated for each group. So, the master part of the table will consist of last name of the customer and the static text for the labels in the detail part. To do so, let us add two row groups, as described in the following sections.
First of all, delete the Header and Footer rows (these are not required in our report),
- Click inside the Table data region to make the row handle appear.
- Right-click the row handle and select Remove Header to remove the header row from the table.
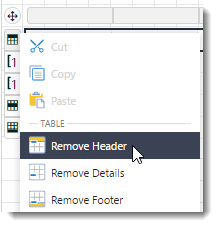
- Again, right-click the row handle and select Remove Footer to remove the footer row from the table.
Add Groups and Bind data to the Groups in Table Data Region
-
To add a group that contains the customer name,
- Right-click any text box (cell) in the details row of the table to view options in the context menu.
- Go to Group and select Insert Group.
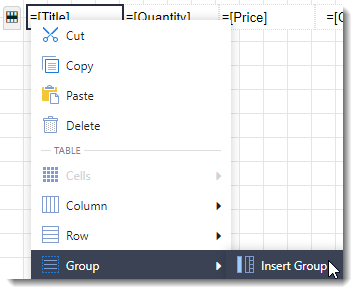
This adds a row group above and below the details row.
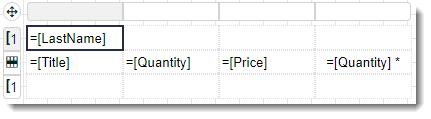
- In the first text box of the added row group, drag and drop the LastName field as shown.
- Right-click a text box in the added row group (above the details row).
- Go to Row and select Below.
Now your table looks similar to the following.
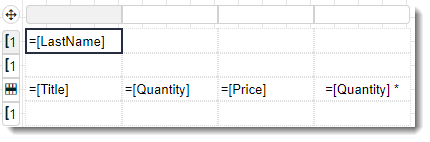
Note that the table groups are also displayed in the adorner on the right side of the Table data region. - In the row group above the details row, enter the labels for the details as shown.
To group the details for each customer,
- From the Explorer
 , select the Tablix data region.
 - Click the Group Editor icon
 to display row group.
 - Select Table1_Group1 row group and go to the Properties pane.
- In the Group Expressions property, click Show Items and then select Add Item.
- Click the radio button to display the fields and select the CustomerID field.
To obtain the sum of prices for each group,
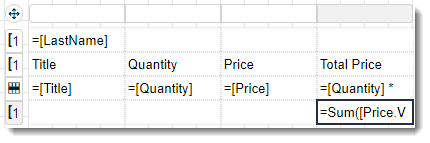
- Go to the last text box of the row group below the details row.
- Enter the expression =Sum(Fields!Price.Value*Fields!Quantity.Value in the same way as we added expression in the Bind Data to Table Data Region section.
The table with bound fields looks as shown.
Add Report Title
- Drag and drop a TextBox control
 above the table. If required, relocate the table to create space for the text box.
 - Click inside the text box and enter the text 'Customer Orders (Master Detail Report)'.
Customize the Appearance of Report
Note: You may need to resize and reposition the controls on the report to accommodate data, and for a cleaner look.
-
To customize the field with the last name,
- Select the LastName field.
- In the Properties pane, set Font Size property to 12pt.

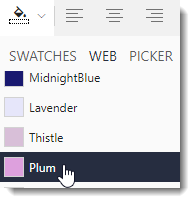
- Set BACKGROUND - Color to Plum from the colors available on Web tab of the color pallet.
To span the last name field over the table,
- Select the cells in the top row group using mouse drag or simply using Ctrl+Click combination.
- Right-click the selected cells to view the options in the context menu, go to Cells and select Merge Cells.
To align the labels,
- Select the label Title and from the Properties pane, set the TEXT - Text Align property to Left.
- Set the TEXT - Text Align property of Quantity, Price, and Total Price text boxes to Center.
To make the labels bold,
- Go to the Properties pane.
- Set the Font Weight property of Title, Quantity, Price, and Total Price text boxes to Bold.

To add background colors for the detail part,
- Select the text boxes of the details row, and the Sum field in the row group below detail row.
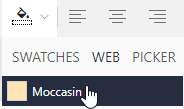
- From the Properties pane, set the BACKGROUND - Color to Moccasin from the colors available on Web tab of the color pallet.
Preview and Save Report
- Click Preview to view your report in the final output.
- Exit the preview mode by clicking Back on the top left side of the designer.
- Switch to the File tab and click Save to open the Save dialog box. Enter the report name and click Save Report. You can also provide a description and a revision comment for the report.