Wijmo UI for the Web
footer Option
wijmo.chart.wijchartcore Namespace > options type : footer Option

Sets up the object to use as the footer of the barchart.

Type: wijmo.chart.chart_title object

Default:

{
    compass: "south", 
    orientation: "horizontal",
    style: {fill: "#fff", stroke: "none"}, 
    textStyle: {fill: "#000", stroke: "none"}, 
    visible: false
}
Syntax
$(function () {
    
    // Get value
    var returnsValue; // Type:  wijmo.chart.chart_title
    returnsValue = $(".selector").wijchartcore("option", "footer");
    
    // Set value
    var newValue; // Type:  wijmo.chart.chart_title
    $(".selector").wijchartcore("option", "footer", newValue);
        
});
var footer : chart_title;
Example

This code creates a chart with a footer that looks like the one in the following image.

<script type="text/javascript">
$(document).ready(function () {
    $("#wijbubblechart").wijbubblechart({
        axis: {
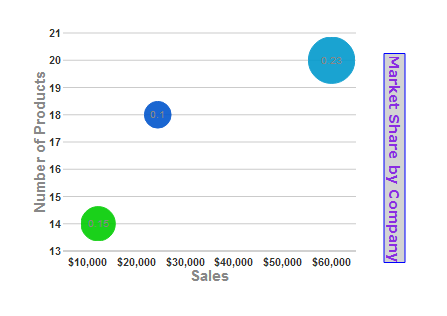
            y: {text: "Number of Products"},
            x: {text: "Sales", annoFormatString: "C0"}
        },
        footer: {
            compass: "east",
            style: {fill: "lightgrey", stroke: "blue"},
            text: "Increase Over Previous Year",
            textStyle: {
                "font-size": 14, 
                fill: "blueviolet", 
                "font-family": "Verdana", 
                "font-weight": "bold"
            },
            visible: true
        },
        legend: {visible: false},
        seriesList: [
        {
            label: "Company A Market Share",
            data: { y: [14], x: [12200], y1: [.15] }
        }, {
            label: "Company B Market Share",
            data: { y: [20], x: [60000], y1: [.23] }
        }, {
            label: "Company C Market Share",
            data: { y: [18], x: [24400], y1: [.1] }
        }]
    });
});
</script>
See Also

Reference

options type
wijchartcore jQuery Widget