A series is a collection of data points that are displayed in the plot area and represents the data trends for one group of data values. A data point can have a marker and a label.
Formulas can be used to add a chart by using data in the sheet. The DataFormula property is used for the data points in each series. The NameFormula property is used for the name of each series. The ItemsFormula property is used for the category name or axis title. The Formula property is for the entire data range for the chart.
You can add values to a chart with a data series or you can add values to the control and then add the chart. You can also set marker properties such as MarkerType, MarkerSize, and DataMarkerStyle.
Using Code
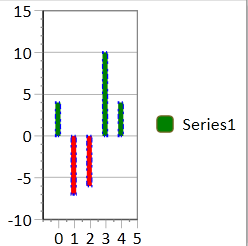
The following example uses a data series to add values to a chart.
-
Create a chart with the SpreadChart class.
-
Add values using the SpreadDataSeries class.
-
Add the chart.
| CS |
Copy Code |
|---|---|
GrapeCity.Windows.SpreadSheet.Data.SpreadChart chart = new GrapeCity.Windows.SpreadSheet.Data.SpreadChart("Chart", GrapeCity.Windows.SpreadSheet.Data.SpreadChartType.ColumnStacked, 0, 0, 200, 200); GrapeCity.Windows.SpreadSheet.Data.SpreadDataSeries ds = new GrapeCity.Windows.SpreadSheet.Data.SpreadDataSeries(); ds.Values.Add(4); ds.Values.Add(-7); ds.Values.Add(-6); ds.Values.Add(10); ds.Values.Add(4); ds.Fill = new SolidColorBrush(Colors.Green); ds.Stroke = new SolidColorBrush(Colors.Blue); ds.StrokeDashType = GrapeCity.Windows.SpreadSheet.Data.StrokeDashType.LongDashDotDot; ds.StrokeThickness = 2; ds.InvertIfNegative = true; ds.NegativeFill = new SolidColorBrush(Colors.Red); chart.DataSeries.Add(ds); gcSpreadSheet1.ActiveSheet.Charts.Add(chart); | |
| VB.NET |
Copy Code |
|---|---|
Dim chart As New GrapeCity.Windows.SpreadSheet.Data.SpreadChart("Chart", GrapeCity.Windows.SpreadSheet.Data.SpreadChartType.ColumnStacked, 0, 0, 200, 200) Dim ds As New GrapeCity.Windows.SpreadSheet.Data.SpreadDataSeries() ds.Values.Add(4) ds.Values.Add(-7) ds.Values.Add(-6) ds.Values.Add(10) ds.Values.Add(4) ds.Fill = New SolidColorBrush(Colors.Green) ds.Stroke = New SolidColorBrush(Colors.Blue) ds.StrokeDashType = GrapeCity.Windows.SpreadSheet.Data.StrokeDashType.LongDashDotDots ds.StrokeThickness = 2 ds.InvertIfNegative = True ds.NegativeFill = New SolidColorBrush(Colors.Red) chart.DataSeries.Add(ds) GcSpreadSheet1.ActiveSheet.Charts.Add(chart) | |