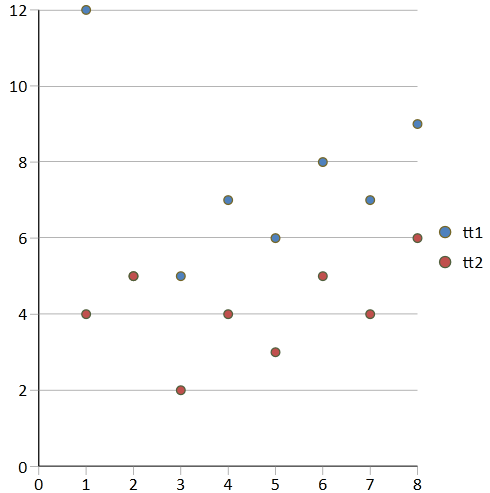
You can create different types of scatter charts such as Scatter, ScatterLines, ScatterLinesSmoothed, ScatterLinesSmoothedWithMarkers, and ScatterLinesWithMarkers. The following image displays a scatter chart.
Using Code
The following code creates a scatter chart.
-
Create values and add the values to the control with the SetArray method.
-
Add the chart and specify the chart type with the AddChart method.
| CS |
Copy Code |
|---|---|
| object[,] values = { { "lg1", "lg2", "lg3", "lg4", "lg5", "lg6", "lg7", "lg8", "lg9" }, { "tt1", 12.0, 5.0, 5, 7, 6, 8, 7, 9 }, { "tt2", 4.0, 5.0, 2, 4, 3, 5, 4, 6 } }; gcSpreadSheet1.Sheets[0].SetArray(0, 0, values); GrapeCity.Windows.SpreadSheet.Data.SpreadChart chart = gcSpreadSheet1.Sheets[0].AddChart("chart1", GrapeCity.Windows.SpreadSheet.Data.SpreadChartType.Scatter, "Sheet1!$A$1:$I$3", 0, 0, 400, 400); | |
| VB.NET |
Copy Code |
|---|---|
| Dim values As Object(,) = {{"lg1", "lg2", "lg3", "lg4", "lg5", "lg6", "lg7", "lg8", "lg9"}, {"tt1", 12.0, 5.0, 5, 7, 6, 8, 7, 9}, {"tt2", 4.0, 5.0, 2, 4, 3, 5, 4, 6}} GcSpreadSheet1.Sheets(0).SetArray(0, 0, values) Dim chart = GcSpreadSheet1.Sheets(0).AddChart("chart1", GrapeCity.Windows.SpreadSheet.Data.SpreadChartType.Scatter, "Sheet1!$A$1:$I$3", 0, 0, 400, 400) | |
See Also