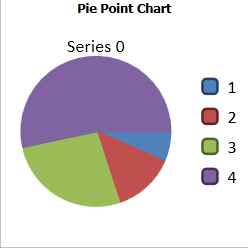
You can create different types of pie charts such as Pie, Pie3D, PieDoughnut, PieExploded, PieExploded3D, or PieExplodedDoughnut. The following image displays a pie chart.
Using Code
The following code creates a pie chart.
-
Create values with the SpreadDataSeries class.
-
Create a chart title and legend.
-
Set the ChartType property.
-
Add the chart.
| CS |
Copy Code |
|---|---|
| GrapeCity.Windows.SpreadSheet.Data.SpreadDataSeries series0 = new GrapeCity.Windows.SpreadSheet.Data.SpreadDataSeries(); series0.Name = "Series 0"; series0.Values.Add(1.0); series0.Values.Add(2.0); series0.Values.Add(4.0); series0.Values.Add(8.0); GrapeCity.Windows.SpreadSheet.Data.ChartTitle label = new GrapeCity.Windows.SpreadSheet.Data.ChartTitle(); label.Text = "Pie Point Chart"; label.FontSize = 10; label.FontFamily = new FontFamily("Tahoma"); GrapeCity.Windows.SpreadSheet.Data.Legend l = new GrapeCity.Windows.SpreadSheet.Data.Legend(); l.Alignment = GrapeCity.Windows.SpreadSheet.Data.LegendAlignment.TopLeft; GrapeCity.Windows.SpreadSheet.Data.SpreadChart chart = new GrapeCity.Windows.SpreadSheet.Data.SpreadChart(); chart.ChartTitle = label; chart.Legend = l; chart.DataSeries.Add(series0); chart.ChartType = GrapeCity.Windows.SpreadSheet.Data.SpreadChartType.Pie; chart.Name = "name1"; this.gcSpreadSheet1.ActiveSheet.Charts.Add(chart); | |
| VB.NET |
Copy Code |
|---|---|
| Dim series0 As New GrapeCity.Windows.SpreadSheet.Data.SpreadDataSeries() series0.Name = "Series 0" series0.Values.Add(1.0) series0.Values.Add(2.0) series0.Values.Add(4.0) series0.Values.Add(8.0) Dim label As New GrapeCity.Windows.SpreadSheet.Data.ChartTitle() label.Text = "Pie Point Chart" label.FontSize = 10 label.FontFamily = New FontFamily("Tahoma") Dim l As New GrapeCity.Windows.SpreadSheet.Data.Legend() l.Alignment = GrapeCity.Windows.SpreadSheet.Data.LegendAlignment.TopLeft Dim chart As New GrapeCity.Windows.SpreadSheet.Data.SpreadChart() chart.ChartTitle = label chart.Legend = l chart.DataSeries.Add(series0) chart.ChartType = GrapeCity.Windows.SpreadSheet.Data.SpreadChartType.Pie chart.Name = "name1" GcSpreadSheet1.ActiveSheet.Charts.Add(chart) | |
See Also