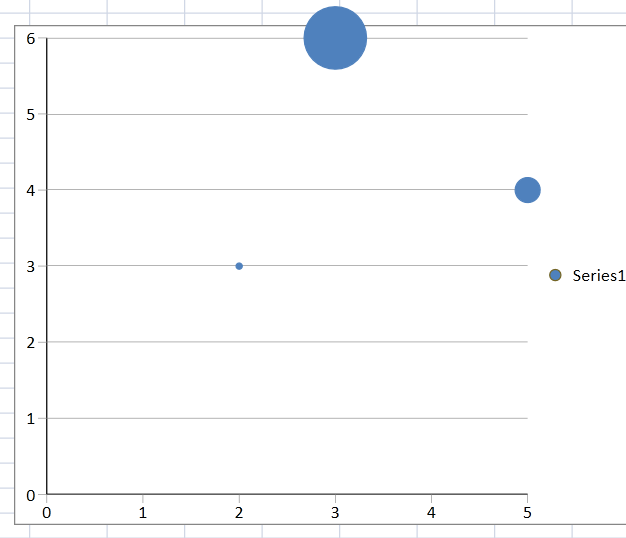
You can create bubble charts as shown in the following image.
Using Code
The following code creates a bubble chart.
-
Create and add values with the SpreadBubbleSeries class.
-
Add the chart and specify the chart type with the AddChart method.
| CS |
Copy Code |
|---|---|
| GrapeCity.Windows.SpreadSheet.Data.SpreadBubbleSeries ds = new GrapeCity.Windows.SpreadSheet.Data.SpreadBubbleSeries(); ds.XValues.Add(2); ds.XValues.Add(3); ds.XValues.Add(5); ds.Values.Add(3); ds.Values.Add(6); ds.Values.Add(4); ds.SizeValues.Add(3); ds.SizeValues.Add(6); ds.SizeValues.Add(4); GrapeCity.Windows.SpreadSheet.Data.SpreadChart sc = gcSpreadSheet1.ActiveSheet.AddChart("chart", GrapeCity.Windows.SpreadSheet.Data.SpreadChartType.Bubble, 50, 50, 500, 400); sc.DataSeries.Add(ds); | |
| VB.NET |
Copy Code |
|---|---|
| Dim ds As New GrapeCity.Windows.SpreadSheet.Data.SpreadBubbleSeries() ds.XValues.Add(2) ds.XValues.Add(3) ds.XValues.Add(5) ds.Values.Add(3) ds.Values.Add(6) ds.Values.Add(4) ds.SizeValues.Add(3) ds.SizeValues.Add(6) ds.SizeValues.Add(4) Dim sc = gcSpreadSheet1.ActiveSheet.AddChart("chart", GrapeCity.Windows.SpreadSheet.Data.SpreadChartType.Bubble, 50, 50, 500, 400) sc.DataSeries.Add(ds) | |
See Also