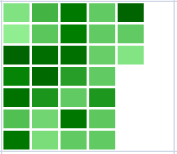
You can create a month sparkline using the MonthSparkline formula and cell values.

A month sparkline has 6*7 squares. The horizontal direction is the week of the month (from left to right, from 1st to 6th). The vertical direction is the week day (from top to bottom, from Sunday to Saturday).
The month sparkline formula has the following options:
| Option | Description |
| year | A full year number, such as 2017. |
| month | A month number, such as 3. The month is 1-based (Jan = 1). |
| dataRange | A reference that represents a range where the first column is a date and the second column is a number, such as "A1:B400". |
| emptyColor | A color string that represents days with no value or zero value, such as "lightgray". |
| startColor | A color string that represents the minimum day value, such as "lightgreen". |
| middleColor | A color string that represents the day with the average minimum and maximum value, such as "green". |
| endColor | A color string that represents the day with the maximum value, such as "darkgreen". |
| colorRange | A reference that represents a range where the data is a color string. |
The month sparkline formula has the following formats:
=MONTHSPARKLINE(year, month, dataRange, emptyColor, startColor, middleColor, endColor)
=MONTHSPARKLINE(year, month, dataRange, colorRange)
Using Code
This example creates a month sparkline.
| JavaScript |
Copy Code
|
|---|---|
| for (var rowIndex = 1; rowIndex <= 31; rowIndex++) { activeSheet.setValue(rowIndex, 0, new Date(2017, 0, rowIndex)); } activeSheet.setValue(1,1,10, GC.Spread.Sheets.SheetArea.viewport); activeSheet.setValue(2,1,5, GC.Spread.Sheets.SheetArea.viewport); activeSheet.setValue(3,1,98, GC.Spread.Sheets.SheetArea.viewport); activeSheet.setValue(4,1,50, GC.Spread.Sheets.SheetArea.viewport); activeSheet.setValue(5,1,75, GC.Spread.Sheets.SheetArea.viewport); activeSheet.setValue(6,1,25, GC.Spread.Sheets.SheetArea.viewport); activeSheet.setValue(7,1,65, GC.Spread.Sheets.SheetArea.viewport); activeSheet.setValue(8,1,30, GC.Spread.Sheets.SheetArea.viewport); activeSheet.setValue(9,1,22, GC.Spread.Sheets.SheetArea.viewport); activeSheet.setValue(10,1,82, GC.Spread.Sheets.SheetArea.viewport); activeSheet.setValue(11,1,89, GC.Spread.Sheets.SheetArea.viewport); activeSheet.setValue(12,1,43, GC.Spread.Sheets.SheetArea.viewport); activeSheet.setValue(13,1,15, GC.Spread.Sheets.SheetArea.viewport); activeSheet.setValue(14,1,12, GC.Spread.Sheets.SheetArea.viewport); activeSheet.setValue(15,1,63, GC.Spread.Sheets.SheetArea.viewport); activeSheet.setValue(16,1,54, GC.Spread.Sheets.SheetArea.viewport); activeSheet.setValue(17,1,77, GC.Spread.Sheets.SheetArea.viewport); activeSheet.setValue(18,1,39, GC.Spread.Sheets.SheetArea.viewport); activeSheet.setValue(19,1,20, GC.Spread.Sheets.SheetArea.viewport); activeSheet.setValue(20,1,65, GC.Spread.Sheets.SheetArea.viewport); activeSheet.setValue(21,1,20, GC.Spread.Sheets.SheetArea.viewport); activeSheet.setValue(22,1,20, GC.Spread.Sheets.SheetArea.viewport); activeSheet.setValue(23,1,20, GC.Spread.Sheets.SheetArea.viewport); activeSheet.setValue(24,1,18, GC.Spread.Sheets.SheetArea.viewport); activeSheet.setValue(25,1,20, GC.Spread.Sheets.SheetArea.viewport); activeSheet.setValue(26,1,42, GC.Spread.Sheets.SheetArea.viewport); activeSheet.setValue(27,1,21, GC.Spread.Sheets.SheetArea.viewport); activeSheet.setValue(28,1,20, GC.Spread.Sheets.SheetArea.viewport); activeSheet.setValue(29,1,99, GC.Spread.Sheets.SheetArea.viewport); activeSheet.setValue(30,1,20, GC.Spread.Sheets.SheetArea.viewport); activeSheet.setValue(31,1,9, GC.Spread.Sheets.SheetArea.viewport); activeSheet.setFormula(6, 2, '=MONTHSPARKLINE(2017,1,A2:B32,"yellow","lightgreen","green","darkgreen")'); spread.resumePaint(); |
|