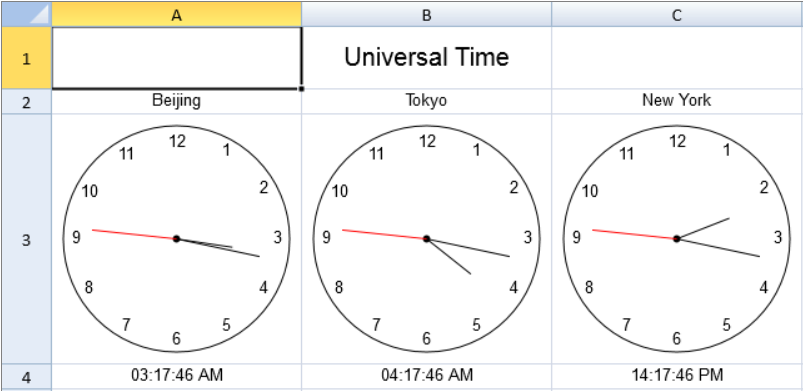
|
function Clock() {
GC.Spread.Sheets.Sparklines.SparklineEx.call(this);
}
Clock.prototype = new GC.Spread.Sheets.Sparklines.SparklineEx();
Clock.prototype.createFunction = function () {
var func = new GC.Spread.CalcEngine.Functions.Function("CLOCK", 1, 1);
func.evaluate = function (args) {
return args[0];
};
return func;
};
Clock.prototype._drawCircle = function (context, centerX, centerY, radius) {
context.beginPath();
context.arc(centerX, centerY, radius, 0, Math.PI * 2, true);
context.stroke();
};
Clock.prototype._drawCenter = function (context, centerX, centerY, radius) {
context.beginPath();
context.arc(centerX, centerY, radius, 0, Math.PI * 2, true);
context.fill();
};
Clock.prototype._drawHand = function (context, centerX, centerY, loc, radius) {
var angle = (Math.PI * 2) * (loc / 60) - Math.PI / 2;
context.beginPath();
context.moveTo(centerX, centerY);
context.lineTo(centerX + Math.cos(angle) * radius, centerY + Math.sin(angle) * radius);
context.stroke();
};
Clock.prototype._drawHands = function (context, value, centerX, centerY, radius) {
var date = value, hour = date.getHours();
hour = hour > 12 ? hour - 12 : hour;
this._drawHand(context, centerX, centerY, hour * 5 + (date.getMinutes() / 60) * 5, radius / 2);
this._drawHand(context, centerX, centerY, date.getMinutes(), radius * 3 / 4);
context.strokeStyle = "red";
this._drawHand(context, centerX, centerY, date.getSeconds(), radius * 3 / 4);
};
Clock.prototype._drawNumerals = function (context, centerX, centerY, radius) {
var numerals = [1, 2, 3, 4, 5, 6, 7, 8, 9, 10, 11, 12],
angle,
numeralWidth;
if (radius > 0) {
numerals.forEach(function (numeral) {
angle = Math.PI / 6 * (numeral - 3);
numeralWidth = context.measureText(numeral).width;
context.beginPath();
context.fillText(numeral, centerX + Math.cos(angle) * radius + numeralWidth / 2, centerY + Math.sin(angle) * radius + numeralWidth / 2);
});
}
};
Clock.prototype.paint = function (context, value, x, y, width, height) {
if (!(value instanceof Date)) {
return;
}
var centerX = x + width / 2,
centerY = y + height / 2,
margin = 10,
padding = 10,
radius = Math.min(width, height) / 2 - margin;
if (radius <= 0) {
return;
}
context.save();
//draw circle
this._drawCircle(context, centerX, centerY, radius);
//draw center
this._drawCenter(context, centerX, centerY, 3);
//draw hands
this._drawHands(context, value, centerX, centerY, radius);
//draw numerals
this._drawNumerals(context, centerX, centerY, radius - padding);
context.restore();
};
spread.addSparklineEx(new Clock());
var sheet = spread.getActiveSheet();
var style = new GC.Spread.Sheets.Style();
style.hAlign = GC.Spread.Sheets.HorizontalAlign.center;
style.vAlign = GC.Spread.Sheets.VerticalAlign.center;
sheet.setDefaultStyle(style);
sheet.getCell(0, 1, GC.Spread.Sheets.SheetArea.viewport).value("Universal Time").font("20px Arial");
sheet.setValue(1, 0, "Beijing");
sheet.setValue(1, 1, "Tokyo");
sheet.setValue(1, 2, "New York");
sheet.setFormula(2, 0, '=CLOCK(A4)');
sheet.setFormula(2, 1, '=CLOCK(B4)');
sheet.setFormula(2, 2, '=CLOCK(C4)');
sheet.getRange(3, -1, 1, -1, GC.Spread.Sheets.SheetArea.viewport).formatter("hh:mm:ss tt");
sheet.setRowHeight(0, 50);
sheet.setRowHeight(2, 200);
sheet.setColumnWidth(0, 200);
sheet.setColumnWidth(1, 200);
sheet.setColumnWidth(2, 200);
function updateTime() {
var now = new Date();
var utcNow = new Date(now.getUTCFullYear(), now.getUTCMonth(), now.getUTCDate(), now.getUTCHours(), now.getUTCMinutes(), now.getUTCSeconds(), now.getUTCMilliseconds());
sheet.setValue(3, 0, new Date(utcNow.setHours(utcNow.getHours() + 8)));//+8
sheet.setValue(3, 1, new Date(utcNow.setHours(utcNow.getHours() + 1)));//+9
sheet.setValue(3, 2, new Date(utcNow.setHours(utcNow.getHours() - 14)));//-5
}
setInterval(updateTime, 1000);
updateTime();
|
