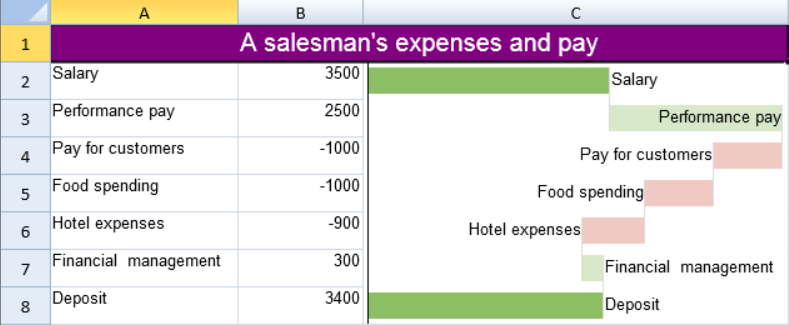
You can add a cascade sparkline using the CascadeSparkline formula and cell values.

The cascade sparkline has the following options:
| Option | Description |
| pointsRange | A reference that represents the range of cells that contains values, such as "B2:B8". |
| pointIndex | A number or reference that represents the points index. The pointIndex is >= 1 such as 1 or "D2". |
| labelsRange | A reference that represents the range of cells that contains the labels, such as "A2:A8". This setting is optional. The default value is no label. |
| minimum | A number or reference that represents the minimum values of the display area. This setting is optional. The default value is the minimum of the sum (the sum of the points' value), such as -2000. The minimum you set must be less than the default minimum; otherwise, the default minimum is used. |
| maximum | A number or reference that represents the maximum values of the display area. This setting is optional. The default value is the maximum of the sum (the sum of the points' value), such as 6000. The maximum you set must be greater than the default maximum; otherwise, the default maximum is used. |
| colorPositive | A string that represents the color of the first or last positive sparkline's box (this point's value is positive). This setting is optional. The default value is "#8CBF64". If the first or last box represents a positive value, the box's color is set to colorPositive. The middle positive box is set to a lighter color than colorPositive. |
| colorNegative | A string that represents the color of the first or last negative sparkline's box (this point's value is negative). This setting is optional. The default value is "#D6604D". If the first or last box represents the negative value, the box's color is set to colorNegative. The middle negative box is set to a lighter color than colorNegative. |
| vertical | A boolean that represents whether the box's direction is vertical or horizontal. This setting is optional. The default value is FALSE. |
The cascade sparkline formula has the following format:
=CASCADESPARKLINE(pointsRange, pointIndex, labelsRange, minimum, maximum, colorPositive, colorNegative, vertical)
You must set vertical to true or false for a group of formulas, because all the formulas represent the entire sparkline.
The point index refers to the point value's index of the points range. In the following example, 2 refers to 2500.
Using Code
The following code creates a cascade sparkline using a group of formulas.
| JavaScript |
Copy Code
|
|---|---|
| activeSheet.addSpan(0, 0, 1, 3); activeSheet.getCell(0, 0, GC.Spread.Sheets.SheetArea.viewport).value("A salesman's expenses and pay") .font("20px Arial") .hAlign(GC.Spread.Sheets.HorizontalAlign.center) .vAlign(GC.Spread.Sheets.VerticalAlign.center) .backColor("purple") .foreColor("white"); activeSheet.getRange(1, 2, 7, 1, GC.Spread.Sheets.SheetArea.viewport).setBorder(new GC.Spread.Sheets.LineBorder("transparent", GC.Spread.Sheets.LineStyle.thin), { inside: true }); activeSheet.setValue(1, 0, "Salary"); activeSheet.setValue(2, 0, "Performance pay"); activeSheet.setValue(3, 0, "Pay for customers"); activeSheet.setValue(4, 0, "Food spending"); activeSheet.setValue(5, 0, "Hotel expenses"); activeSheet.setValue(6, 0, "Financial management"); activeSheet.setValue(7, 0, "Deposit"); activeSheet.setValue(1, 1, 3500); activeSheet.setValue(2, 1, 2500); activeSheet.setValue(3, 1, -1000); activeSheet.setValue(4, 1, -1000); activeSheet.setValue(5, 1, -900); activeSheet.setValue(6, 1, 300); activeSheet.setFormula(7, 1, '=sum(B2:B7)'); activeSheet.setColumnWidth(0,150); activeSheet.setColumnWidth(1,100); activeSheet.setColumnWidth(2, 340); activeSheet.setRowHeight(0, 30); activeSheet.setRowHeight(1, 30); activeSheet.setRowHeight(2, 30); activeSheet.setRowHeight(3, 30); activeSheet.setRowHeight(4, 30); activeSheet.setRowHeight(5, 30); activeSheet.setRowHeight(6, 30); activeSheet.setRowHeight(7, 30); activeSheet.setFormula(1, 2, '=CASCADESPARKLINE(B2:B8,1,A2:A8,,,"#8CBF64","#D6604D",false)'); activeSheet.setFormula(2, 2, '=CASCADESPARKLINE(B2:B8,2,A2:A8,,,"#8CBF64","#D6604D",false)'); activeSheet.setFormula(3, 2, '=CASCADESPARKLINE(B2:B8,3,A2:A8,,,"#8CBF64","#D6604D",false)'); activeSheet.setFormula(4, 2, '=CASCADESPARKLINE(B2:B8,4,A2:A8,,,"#8CBF64","#D6604D",false)'); activeSheet.setFormula(5, 2, '=CASCADESPARKLINE(B2:B8,5,A2:A8,,,"#8CBF64","#D6604D",false)'); activeSheet.setFormula(6, 2, '=CASCADESPARKLINE(B2:B8,6,A2:A8,,,"#8CBF64","#D6604D",false)'); activeSheet.setFormula(7, 2, '=CASCADESPARKLINE(B2:B8,7,A2:A8,,,"#8CBF64","#D6604D",false)'); |
|
See Also