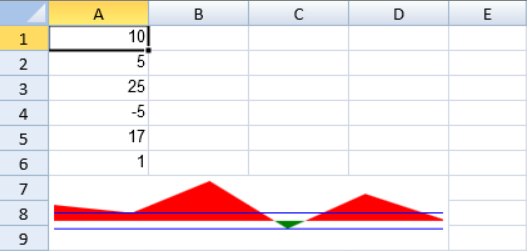
You can create an area sparkline using the AreaSparkline formula and cell values.

The area sparkline formula has the following options:
| Option | Description |
| Points | A cell range. Invalid numbers are ignored. |
| Min | A number that represents the minimum value of the sparkline. This setting is optional. |
| Max | A number that represents the maximum value of the sparkline. This setting is optional. |
| Line1 | A number that represents a horizontal line's vertical position. This setting is optional. |
| Line2 | A number that represents a second horizontal line's vertical position. This setting is optional. |
| ColorPositive | A string that represents the area color of positive values. This setting is optional. |
| ColorNegative | A string that represents the area color of negative values. This setting is optional. |
The area formula has the following format:
=AREASPARKLINE(points, min, max, line1, line2, colorPositive, colorNegative)
Using Code
This example creates an area sparkline.
| JavaScript |
Copy Code
|
|---|---|
| activeSheet.addSpan(6, 0, 3, 4); activeSheet.setValue(0, 0, 10); activeSheet.setValue(1, 0, 5); activeSheet.setValue(2, 0, 25); activeSheet.setValue(3, 0, -5); activeSheet.setValue(4, 0, 17); activeSheet.setValue(5, 0, 1); activeSheet.setFormula(6, 0, '=AREASPARKLINE(A1:A6,-15,15,5,-5,"red","green")'); activeSheet.setColumnWidth(0, 80); activeSheet.setColumnWidth(1, 80); activeSheet.setColumnWidth(2, 80); activeSheet.setColumnWidth(3, 80); |
|
See Also