SpreadJS Documentation
Set Chart Color with Transparency
SpreadJS Documentation > Developer's Guide > Managing Data Visualization and Objects > Understanding Chart > Set Chart Color with Transparency

SpreadJS provides support for transparency while configuring different chart elements in order to allow users to customize the chart area background color, the chart data labels, chart axes and series etc.

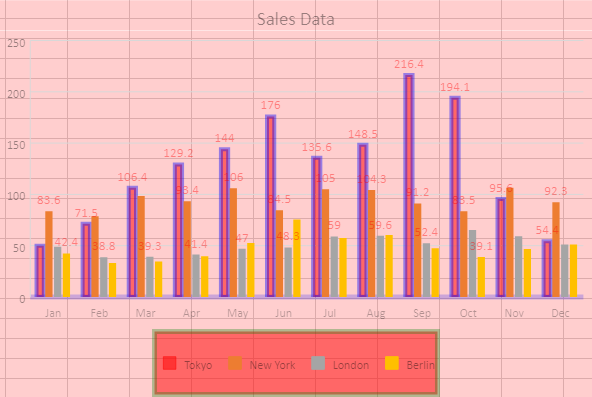
The following image shows a chart depicting the Sales data for four different countries wherein different chart elements have been customized in order to set transparency.


Using Code

The following example code shows how to set chart color with transparency.

JavaScript
Copy Code

window.onload = function ()
{
  var spread = new GC.Spread.Sheets.Workbook(document.getElementById("ss"));
  sheet = spread.getActiveSheet();
  sheet.suspendPaint();

  var dataArray = 
    [
      ["", 'Jan', 'Feb', 'Mar', 'Apr', 'May', 'Jun', 'Jul', 'Aug', 'Sep',

        'Oct', 'Nov', 'Dec'],


      ["Tokyo", 49.9, 71.5, 106.4, 129.2, 144.0, 176.0, 135.6, 148.5,

         216.4, 194.1, 95.6, 54.4],


      ["New York", 83.6, 78.8, 98.5, 93.4, 106.0, 84.5, 105.0, 104.3,

        91.2, 83.5, 106.6, 92.3],
       

      ["London", 48.9, 38.8, 39.3, 41.4, 47.0, 48.3, 59.0, 59.6,

         52.4, 65.2, 59.3, 51.2],
      

      ["Berlin", 42.4, 33.2, 34.5, 39.7, 52.6, 75.5, 57.4, 60.4,

        47.6, 39.1, 46.8, 51.1]
      ];
       

 sheet.setArray(0, 0, dataArray);

 // Add a column chart of type - columnClustered 
 chart_columnClustered = sheet.charts.add

 ('chart_columnClustered',GC.Spread.Sheets.Charts.ChartType.columnClustered,

    300, 180, 600, 400, "A1:M5");

 // Set transparency for chart title
 chart_columnClustered.title
 ({
    text: "Sales Data",
    color: "blue",
    transparency: 0.5
  });


// Set transparency for chart legend back color and border.
chart_columnClustered.legend
   ({
       backColor: "red",
       backColorTransparency: 0.5,
       borderStyle: 
       {
         color: "green",
         width: 5,
         transparency: 0.7
       }
    });


// Set transparency for chart area back color.
chart_columnClustered.chartArea
     ({
                backColor: "red",
                backColorTransparency: 0.9,
                color: "black",
                transparency: 0.6
     });       


// Set transparency for chart data labels.
chart_columnClustered.dataLabels
     ({
                showValue: true,
                color: "red",
                transparency: 0.6
      });

// Set transparency for chart axes.            
chart_columnClustered.axes
      ({
                primaryCategory:
          {
                    lineStyle:
             {
                        color: "blue",
                        width: 5,
                        transparency: 0.8
              },
                    style:
              {
                        color: "black",
                        transparency: 0.7
               },
                    title:
               {
                        color: "dark",
                        transparency: 0.4
                }
             }
        });

// Set transparency for chart series.
var series1 = chart_columnClustered.series().get(0);
series1.backColor = "red";
series1.backColorTransparency = 0.5;
series1.border = 
      {
            color: "blue",
            width: 4,
            transparency: 0.6
       }
            chart_columnClustered.series().set(0, series1);

            sheet.resumePaint();
};